


AVDINPC
26
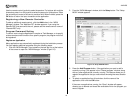
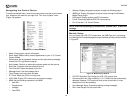
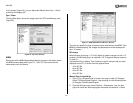
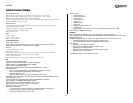
plug-in from the pop-up menu.) The “Winamp Preferences” window
appears.
3. Click “Visualization” under “Plug-ins”.
4. Click to select the “L.I.S. Control Center Visualization Plug-in V2.04” from
the “Visualization Plug-ins” box.
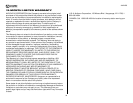
5. Click the Start button to activate the plug-in.
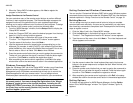
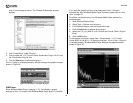
If the L.I.S plug-in is installed properly, Winamp displays the graphic analyzer
shown in Figure 29.
WMPlayer
When Windows Media Player is playing, L.I.S. 2 will display a graphic
analyzer on the L.I.S screen if the Windows Media Player plug-in is installed.
If you want the graphic analyzer to be displayed on the L.I.S screen
automatically when Windows Media Player is sensed, please refer to “Auto
User” on page 23.
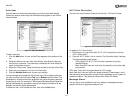
To add the visualization plug-in for Windows Media Player, perform the
following steps:
1. Open Windows Media Player
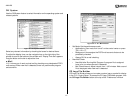
2. Select Tools > Options from the menu.
3. In the Options window, click the Visualizations tab.
4. Click the Add button to browse for the plugin.
5. Select the “LIS_Vis_WMP X.xx.dll” file from the Control Center “Plugins”
folder.
6. Click the OK button.
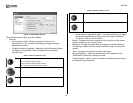
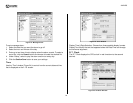
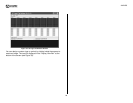
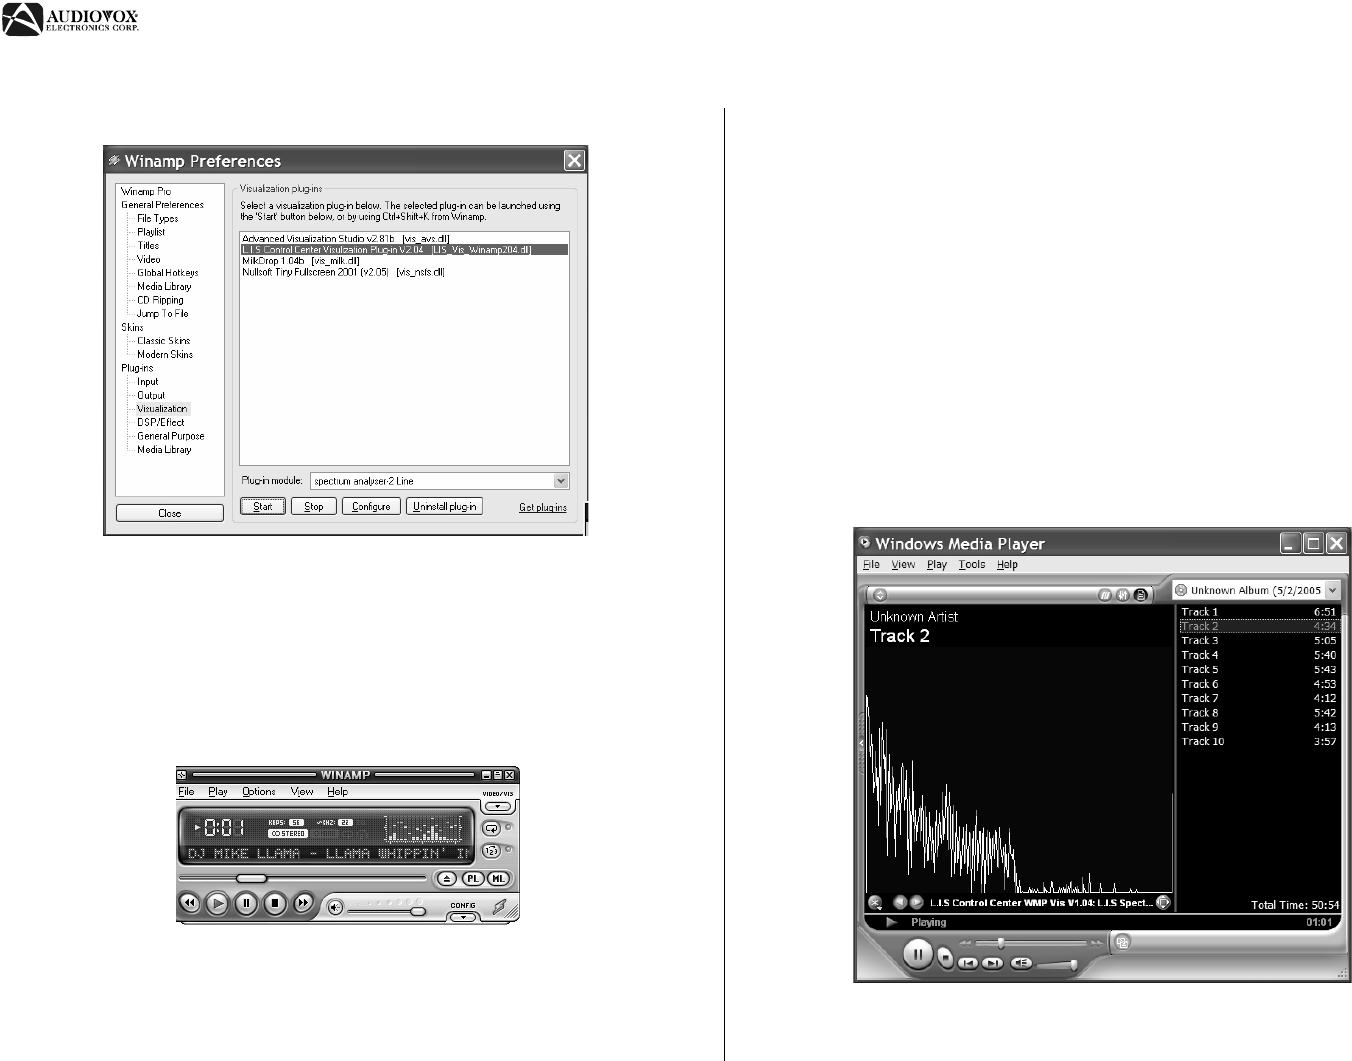
To activate the new plugin, select View > Visualizations > L.I.S. Control
Center WMP Vis V#.## > L.I.S. Spectrum Analyzer - 2Line. If the L.I.S plug-in
is installed properly, Windows Media Player displays the graphic analyzer
shown in Figure 30.
Figure 28: Winamp Preferences Window
Figure 29: Winamp L.I.S. Graphic Analyzer
Figure 30: Windows Media Player L.I.S. Graphic Analyzer Plugin