


22 HX-D2
English
●About P.EQ adjustment
The P.EQ menu contains the following
adjustment items.
• Selection of channel (LEFT/RIGHT)
Select the channel (left or right) to be adjusted.
• Selection of band (BAND)
Select the frequency band (1 to 5) to be adjusted.
• Selection of center frequency (fo)
Select the frequency to be taken as the center
frequency in frequency correction.
Bands 1 to 3: Select from the range 50 Hz to
20 kHz (1/3 octave steps, 27 points)
Bands 4 and 5: Select from the range 630 Hz
to 20 kHz (1/3 octave steps, 16 points)
• Gain adjustment (GAIN)
Gain (output level) can be adjusted within the
range -12 dB to +12 dB.
(0.5 dB steps, 49 points)
• Selection of Q-curve (Q)
Select the sharpness of the Q-curve within the
range 0.5 to 12.0.
(0.5 steps, 24 points)
• Copying adjustment values (COPY)
Select whether or not to copy the channel settings
currently being adjusted to another channel.
When you press the [s] button, the copy
confirmation screen is displayed.
* L: shows the channel being adjusted while R:
shows un-adjusted channels.
Holding down the [s] button for about 1
second copies the settings, and returns to the
previous screen.
To return to the previous screen without
copying the settings, press the [s] button.
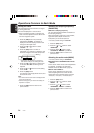
●About correction
When the frequency characteristics are
measured by a measuring device, they do not
need to be corrected if the frequency
characteristics are flat (no ridges or valleys in
the frequency waveform). However, frequency
characteristics sometimes partially rise up or fall
down. If this happens, create a frequency curve
of inverse characteristics matched to the center
frequency of the ridges or valleys in the
frequency waveform. This corrects the frequency
characteristics so that they are flat.
"Correction" is the process or making frequency
characteristics as flat as possible.
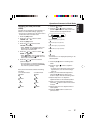
Operations Common to Each Mode
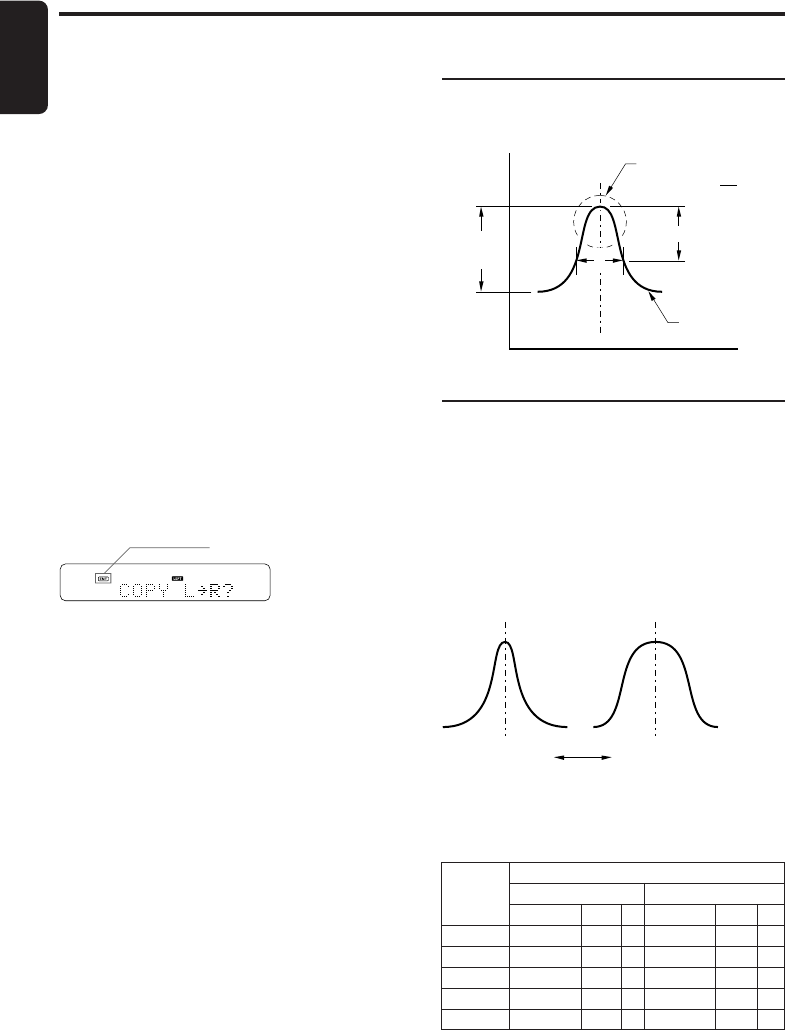
fo: Center frequency, G: gain (output level),
Q: Q-curve
Q-curve
12
Q-curve
0.5
Blinking
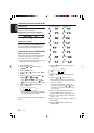
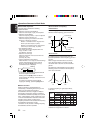
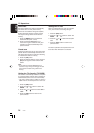
About correction of frequency
characteristics
The following figure shows the relationship
between center frequency, gain and Q-curve.
3dB
Q =
F
f
f
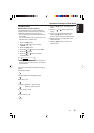
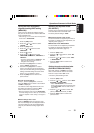
About Q-curve
The following figure and the table show the
relationship between center frequency, gain and
Q-curve.
When a large numerical value is set, the Q-
curve becomes sharper, and when a small
numerical value is set, the Q-curve becomes
gentler.
Flat frequency characteristics can be made by
selecting a Q-curve inverted to the frequency
curve to be corrected.
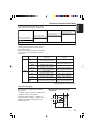
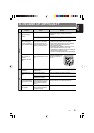
BAND
Parametric equalizer parameters
Left channel Right channel
fo G Q fo G Q
BAND1 50Hz*1 0dB 1 50Hz*1 0dB 1
BAND2 160Hz*1 0dB 1 160Hz*1 0dB 1
BAND3 500Hz*1 0dB 1 500Hz*1 0dB 1
BAND4 2kHz*2 0dB 1 2kHz*2 0dB 1
BAND5 8kHz*2 0dB 1 8kHz*2 0dB 1
*1 Select from range 50 Hz to 20 kHz
*2 Select from range 630 Hz to 20 kHz
Gain (G)
Q-curve (Q)
Frequency
curve
Level
(dB)