63230-300-212 Chapter 3—Operation
April 2001 Viewing Metered Data
39
© 2001 Schneider Electric All Rights Reserved
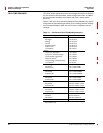
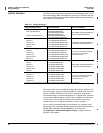
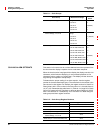
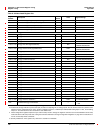
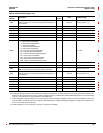
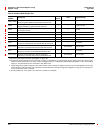
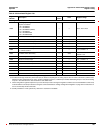
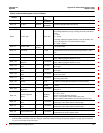
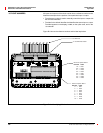
— Fundamental volts and phase angle
— Fundamental amperes and phase angle
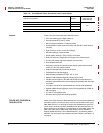
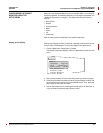
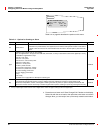
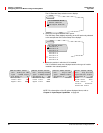
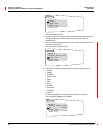
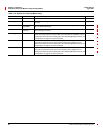
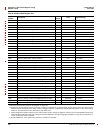
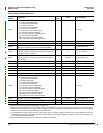
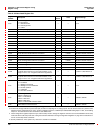
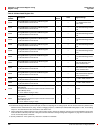
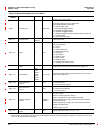
• Energy—shows accumulated and incremental readings for real and
reactive energy into and out of the load, and the real, reactive, and
apparent total of all three phases.
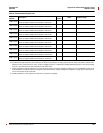
• Power Demand—displays total and peak power demand kW, kVAR, and
kVA (real, reactive, and apparent power) for the last completed demand
interval. It also shows the peak power demand kW, kVAR, and kVA with
date, time, and coincident power factor (leading and lagging) associated
with that peak.
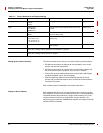
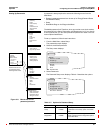
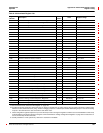
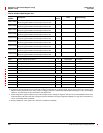
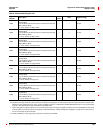
• Current Demand—shows total and peak demand current for all three
phases, neutral, and ground. It also shows the date and time of the peak
demand current.
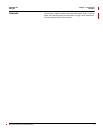
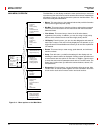
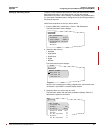
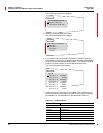
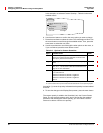
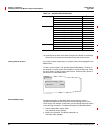
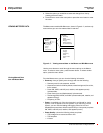
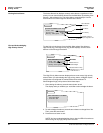
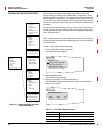
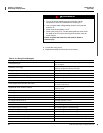
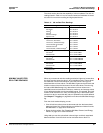
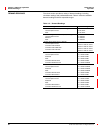
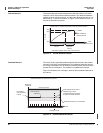
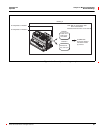
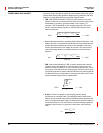
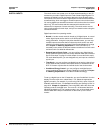
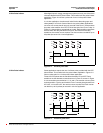
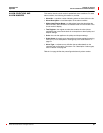
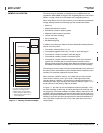
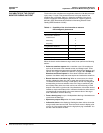
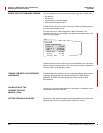
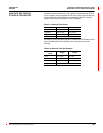
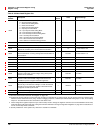
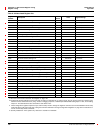
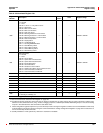
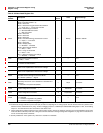
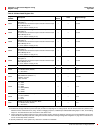
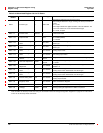
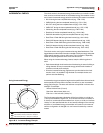
From the Min/Max menu you can view the minimum and maximum values
recorded by the circuit monitor, and the date and time when that min or max
value occurred. These values that can be view are:
• Current
• Voltage
• Frequency
• Power
• Power Factor
• THD
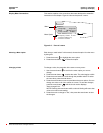
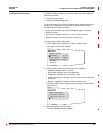
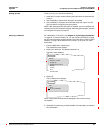
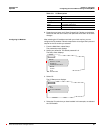
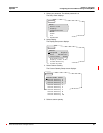
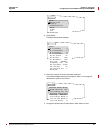
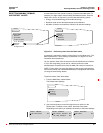
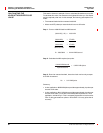
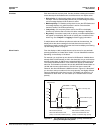
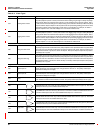
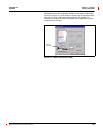
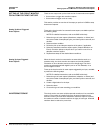
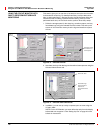
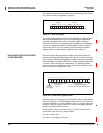
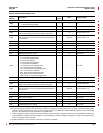
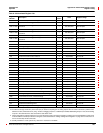
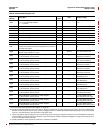
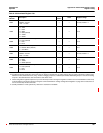
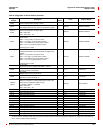
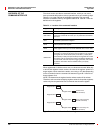
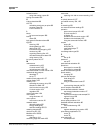
To use the Min/Max menu, follow these steps:
1. Use the arrow buttons to scroll through the menu options on the Min/Max
menu.
2. To select a menu option, press the enter button.
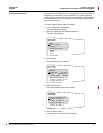
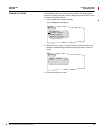
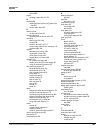
The screen for that value displays. Press the arrow buttons to scroll
through the min/max quantities.
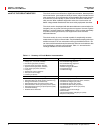
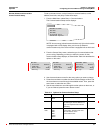
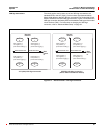
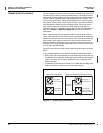
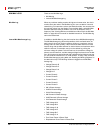
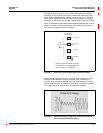
Viewing Minimum and Maximum Values
from the Min/Max Menu
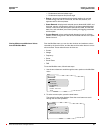
MIN/MAX
Current
Voltage
Frequency
Power
Power Factor
THD
CURRENT A
Min 0A
Max 0A
Press Enter for D/T