63230-300-212 List of Figures
April 2001
vii
© 2001 Schneider Electric All Rights Reserved
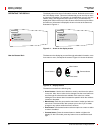
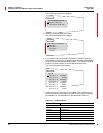
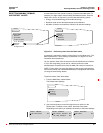
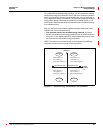
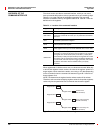
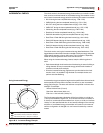
Figure 3–1: Arrowonthedisplayscreen........................ 10
Figure 3–2: Displaybuttons.................................. 10
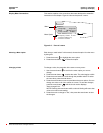
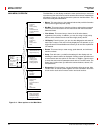
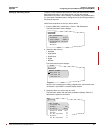
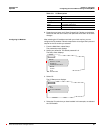
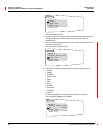
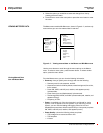
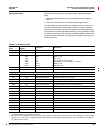
Figure 3–3: Partsofamenu ................................. 11
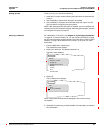
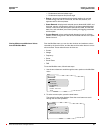
Figure 3–4: MenuoptionsontheMainMenu.................... 12
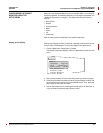
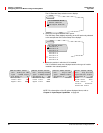
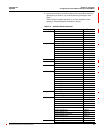
Figure 3–5: Menusthatcanbepasswordprotected............... 27
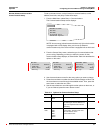
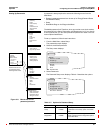
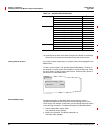
Figure 3–6: PerformingresetsfromtheResetmenu .............. 37
Figure 3–7: Viewing metered data on the Meters and Min/Max
menus......................................... 38
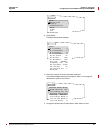
Figure 3–8: ViewAlarmsmenu............................... 41
Figure 3–9: DiagnosticsMenuaccessedfromtheMainMenu....... 44
Figure 3–10: Wiring Error Test option on the Diagnostics menu. ...... 45
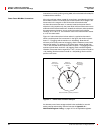
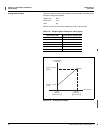
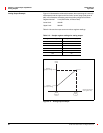
Figure 4–1: Powerfactormin/maxexample ..................... 54
Figure 4–2: Reactive Power—VARsignconvention............... 55
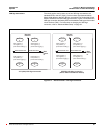
Figure 4–3: BlockIntervalDemandExamples ................... 58
Figure 4–4: ThermalDemandExample......................... 60
Figure 4–5: PredictedDemandExample........................ 60
Figure 4–6: Channel pulse metering example. . .................. 63
Figure 4–7: Reactiveenergyaccumulatesinfourquadrants ........ 65
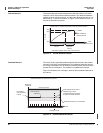
Figure 5–1: Demandsynchpulsetiming........................ 72
Figure 5–2: Analoginputexample............................. 74
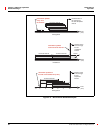
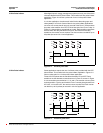
Figure 5–3: Two-wirepulsetrain.............................. 79
Figure 5–4: Three-wirepulsetrain............................. 79
Figure 5–5: Analogoutputexample............................ 82
Figure 6–1: Samplealarmlogentry ........................... 86
Figure 6–2: How the circuit monitor handles setpoint-driven alarms. . . 86
Figure 6–3: Two alarms set up for the same quantity with different
pickup and dropout set points 87
Figure 7–1: Memoryallocationexample....................... 104
Figure 7–2: MemoryallocationinSMS........................ 105
Figure 8–1: Event capture initiated from a high-speed input. . ...... 112
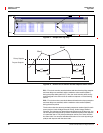
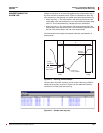
Figure 9–1: A fault can cause voltage sag on the whole system. . . . . 115
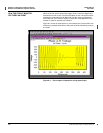
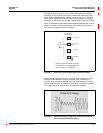
Figure 9–2: Waveform showing voltage sag, which was caused by a
remote fault and lasted five cycles. 115
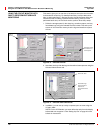
Figure 9–3: OnboardFilestab............................... 118
Figure 9–4: OnboardAlarms/Eventstab....................... 118
Figure 9–5: Eventlogentriesexample ........................ 119
Figure 9–6: Samplealarmlogentry .......................... 119
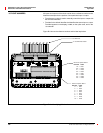
Figure 10–1:Memorychiplocationinthecircuitmonitor ........... 123
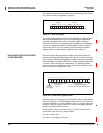
Figure A–1: Bitsinaregister................................ 128
Figure A–2: Powerfactorregisterformat....................... 128
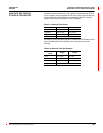
Figure B–1: CommandInterfacePointerRegisters............... 182
Figure B–2: Identifying I/Os for the command interface............ 186
Figure B–3: IncrementEnergyExample ....................... 189
LIST OF FIGURES