


This navigation system is equipped with an
Eco-driving function that can be used to esti-
mate whether you are driving in an environ-
mentally friendly way.
This chapter describes this function.
! The fuel mileage calculated is based on a
theoretical value determined from vehicle
speed and position information from the
navigation system. The fuel mileage dis-
played is only a reference value, and does
not guarantee the mileage displayed can be
obtained.
! The Eco-driving functions are an estimate
of the real time fuel consumption to aver-
age fuel consumption ratio and is not an
actual value.
! The Eco-driving functions and calculations
take into consideration the location of the
GPS position and speedof thevehicle in de-
termining a value.
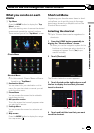
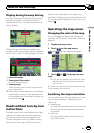
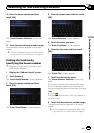
Displaying “Eco Graph”
This function estimates approximate fuel mile-
age based on your driving, compares that with
your average fuel mileage in the past, and dis-
plays the results in a graph.
The graph appears when the map display is
set to “Eco Graph”.
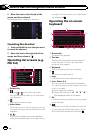
1 Display the “Map Settings” screen.
= For details, refer to Displaying the “Map
Settings” screen on page 154.
2 Touch [View Mode].
The “View Mode” screen appears.
3 Touch [Eco Graph].
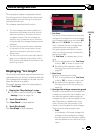
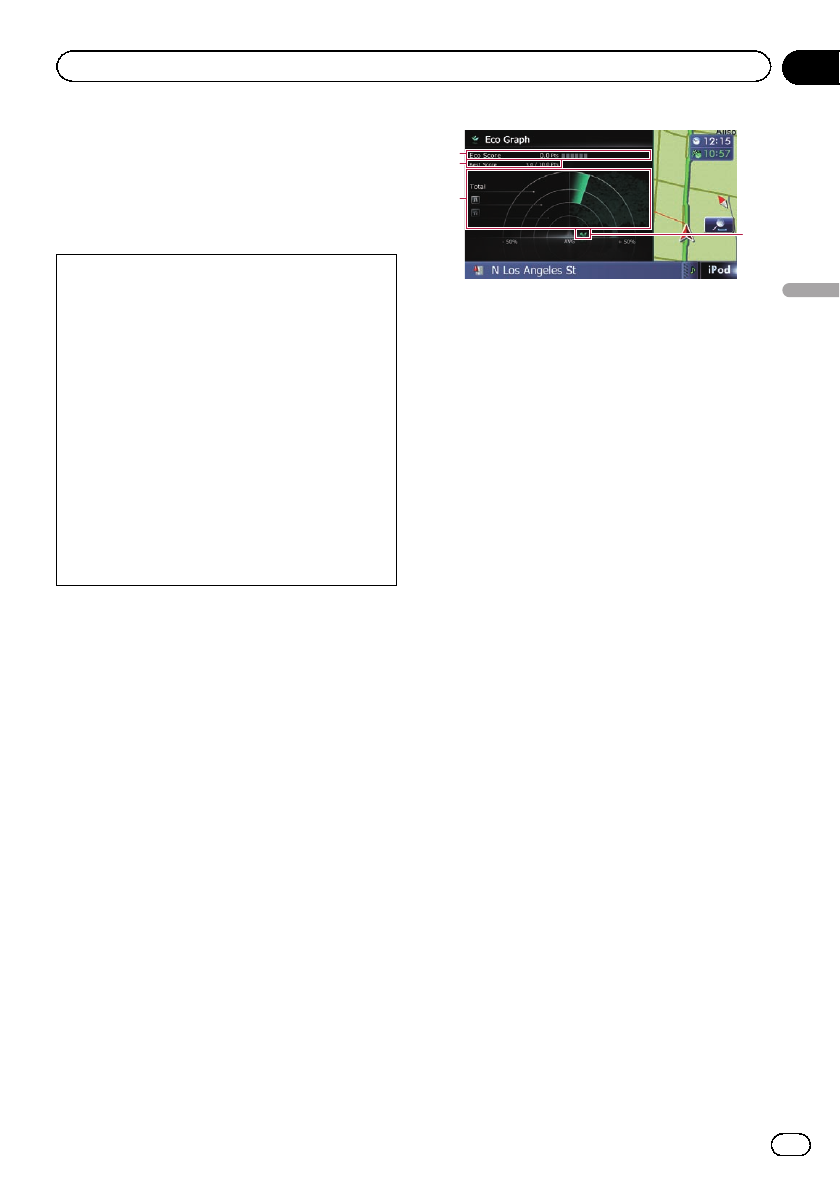
The “Eco Graph” screen appears.
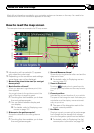
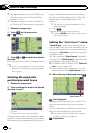
2
4
3
1
1 Eco Score
The result of the comparison of your past
average fuel mileage and current average
fuel mileage appears as a value from 0.0
Pts (points) to 10.0 Pts. The higher the
value, the better the fuel mileage when
compared to past route guidance.
The green gauge indicates the current
score, and the gray gauge indicates the
best score to date.
The “Eco Score” is updated every 5 min-
utes.
p This is not displayed when “Eco Score”
is set to “Off” or when no route is set.
= For details of the operation, refer to
Changing the eco-function setting on
page 153.
2 Best Score
Displays the best score to date.
p This is not displayed when “Eco Score”
is set to “Off” or when no route is set.
= For details of the operation, refer to
Changing the eco-function setting on
page 153.
3 Average fuel mileage comparison graph
Displays a comparison of the average fuel
mileage up to the point the navigation sys-
tem was last stopped (past average fuel
mileage) and the current average fuel mile-
age. The display is updated every 3 sec-
onds. The more the value moves in the
direction of +, the better the fuel mileage.
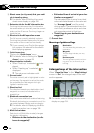
There are three different graph bars.
! Total
A comparison of the past average fuel
mileage and the average fuel mileage
from the location the navigation system
was last started to the current driving lo-
cation.
En
31
Chapter
05
Eco-driving function
Eco-driving function