


A-2
hsb
2
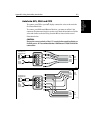
PLUS Series Color LCD Display
hsb
2
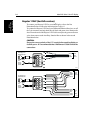
Series 7"and
10.4" LCD Color
Displays
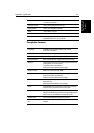
Radar Features
Cursor Echo Cursor Echo between radar and chart on split screen and/or
separate displays connected via SeaTalk.
Man Overboard
(MOB Mode)
Mark placed with course line; readout shows range, bearing,
lat/lon of MOB and time elapsed since MOB.
Screen Functions Full, half and quarter screens available dependent on function
Radar/Chart Overlay Radar image can be overlaid on full-screen chart
Data Boxes Up to six user selectable information boxes
Range Scales (Range Rings) 0.125 (0.0625), 0.25 (0.125), 0.5 (0.125), 0.75 (0.25), 1.5 (0.25),
3 (0.5), 6 (1), 12 (2), 24 (4), 48 (8) or 72 (12) nm selectable (depen-
dent on scanner).
Performance limited by the scanner type and position.
Range scales can be customized
Range Ring Accuracy Better than +/– 1.5% of the max. range scale in use,
or 22 m (72 ft.), whichever is the greatest.
Bearing Accuracy +/– 1°
Variable Range Markers 2xVRMs, readout nm, kyds, sm, km
Electronic Bearing Lines 2xEBLs, floating if required, resolution 1°
Bearing Scale 360° graduated at 10° intervals
Minimum Range 23 m (25 yds)
Range Discrimination 23 m (25 yds)
Presentation Modes Head up, Course up or North up (selectable True or Magnetic)
Relative or True Motion
Scanner Control Interference rejection, standby/transmit modes, pulse selection,
Tune, Rain, FTC, and Sea controls, with selection of manual or auto-
matic control of gain, sea clutter and tune (Auto GST
TM
)
Magnetic Sensor NMEA or Seatalk
Waypoint Navigation Lollipop symbol, WPT range, bearing, TTG or lat/lon readout
Marks 100 Mark database
MARPA Manual acquisition of 10 targets, automatic tracking, dangerous
target alarms, safe zone, target history, true or relative vectors
Variation Source Auto (SeaTalk/NMEA/Internal algorithm) or Manual
Guard Zone Alarm 2 guard zones, selectable sensitivity level, audible alarm
Radar/Chart Synchroniza-
tion
User selectable in split screen mode provided chart data available