Chapter 9 Dashboard
ZyWALL USG 300 User’s Guide
224
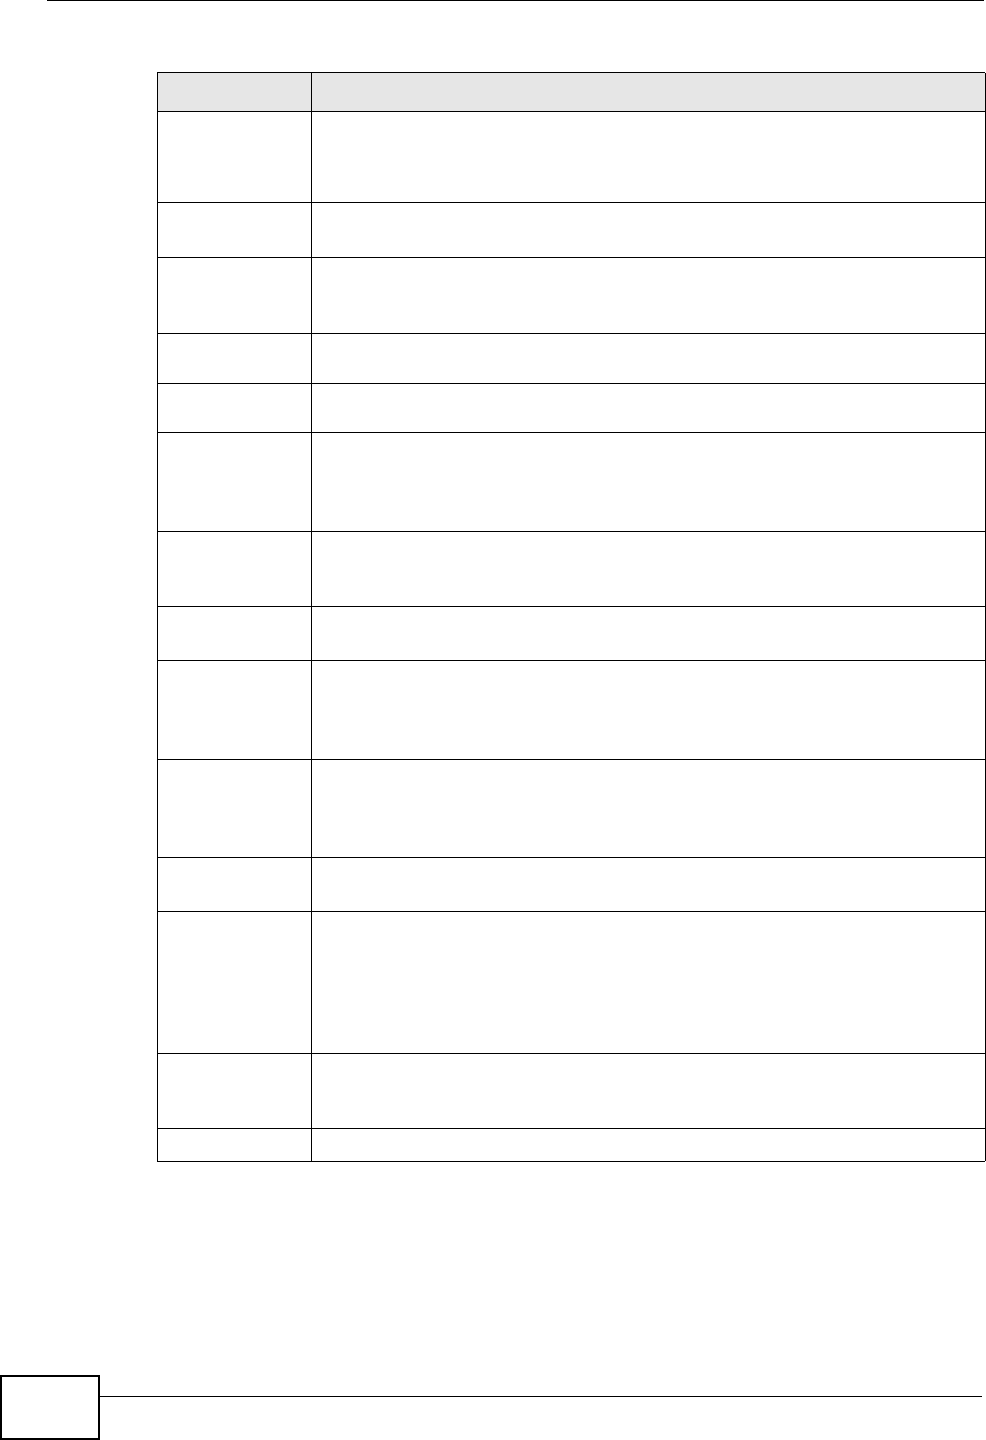
Device This identifies a device installed in one of the ZyWALL’s extension slots
or USB ports.
Device
Information
System
Name
This field displays the name used to identify the ZyWALL on any
network. Click the icon to open the screen where you can change it. See
Section 50.2 on page 810.
Model
Name
This field displays the model name of this ZyWALL.
Serial
Number
This field displays the serial number of this ZyWALL.
MAC
Address
Range
This field displays the MAC addresses used by the ZyWALL. Each physical
port has one MAC address. The first MAC address is assigned to physical
port 1, the second MAC address is assigned to physical port 2, and so
on.
Firmware
Version
This field displays the version number and date of the firmware the
ZyWALL is currently running. Click the icon to open the screen where
you can upload firmware. See Section 52.3 on page 880.
System
Resources
CPU Usage This field displays what percentage of the ZyWALL’s processing capability
is currently being used. Hover your cursor over this field to display the
Show CPU Usage icon that takes you to a chart of the ZyWALL’s recent
CPU usage.
Memory
Usage
This field displays what percentage of the ZyWALL’s RAM is currently
being used. Hover your cursor over this field to display the Show
Memory Usage icon that takes you to a chart of the ZyWALL’s recent
memory usage.
Flash Usage This field displays what percentage of the ZyWALL’s onboard flash
memory is currently being used.
Active
Sessions
This field displays how many traffic sessions are currently open on the
ZyWALL. These are the sessions that are traversing the ZyWALL. Hover
your cursor over this field to display icons. Click the Detail icon to go to
the Session Monitor screen to see details about the active sessions.
Click the Show Active Sessions icon to display a chart of ZyWALL’s
recent session usage.
Interface
Status
Summary
If an Ethernet interface does not have any physical ports associated with
it, its entry is displayed in light gray text. Click the Detail icon to go to a
(more detailed) summary screen of interface statistics.
Name This field displays the name of each interface.
Table 21 Dashboard (continued)
LABEL DESCRIPTION
