


7306ENG.DOC Statistical Plots and Analyses Julie Hewlett Revised: 05/29/98 3:52 PM Printed: 05/19/99 9:00 AM
Page 107 of 20
Statistical PlotsStatistical Plots
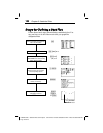
Steps for Defining a Stat Plot ...........................................108
Defining Statistical Data in Lists .......................................109
Deselecting Y
n
Functions..................................................109
Defining a Stat Plot ...........................................................109
Selecting Stat Plot Types ...................................................111
Defining Stat Plot Options................................................112
Adjusting Window Values and Format ............................114
Displaying the Stat Plot.....................................................114
Stat Plot Examples .............................................................114
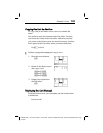
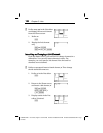
Scatter Plot Ô and xyLine Plot Ó........................114
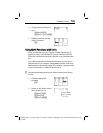
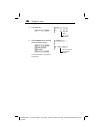
Pictograph Î............................................................117
Bar Graph Ð .............................................................118
Pie Chart Ï ................................................................120
Histogram Ò ...........................................................121
Box Plot Ö...............................................................123
Modified Box Plot Õ ..............................................124
6