


140
Chapter 7: Statistical Analyses
7307ENG.DOC CH 7, Statistical Analyses, English Julie Hewlett Revised: 07/29/98 12:07 PM Printed: 05/19/99
9:00 AM Page 140 of 22
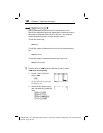
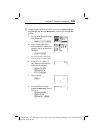
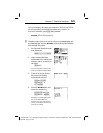
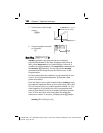
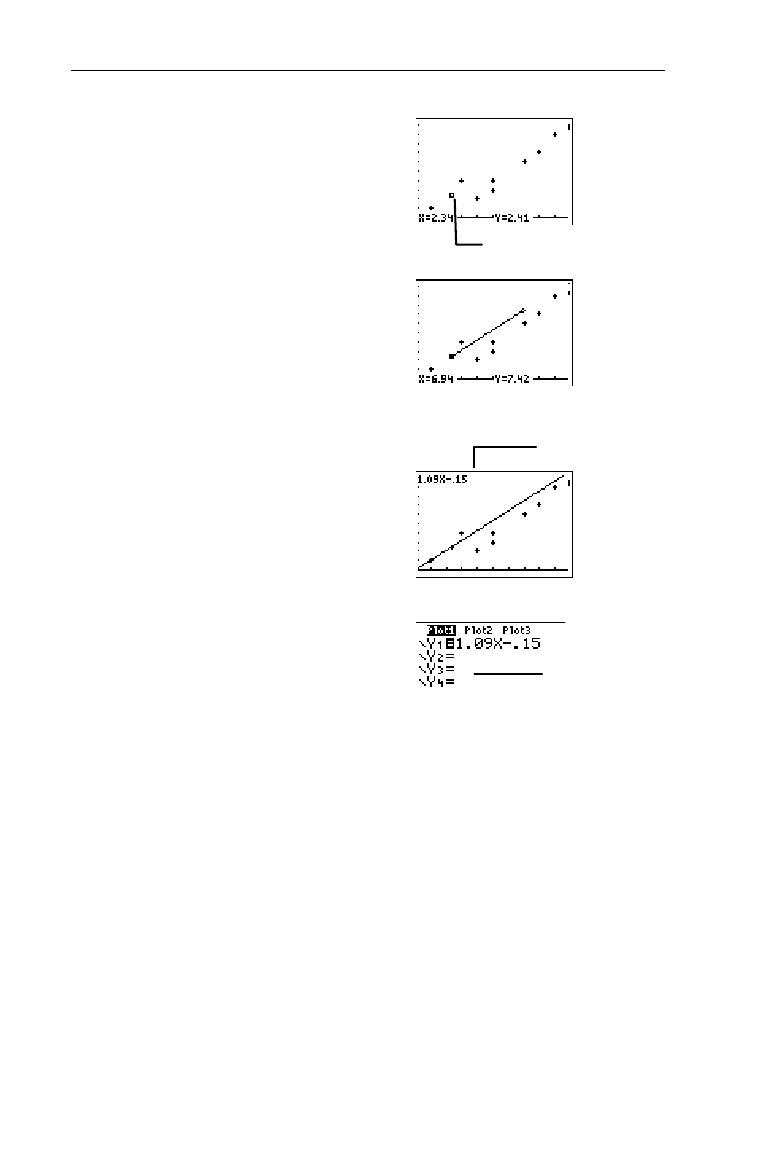
6. Move the cursor to the
beginning point of line.
"!$# (as
necessary)
b
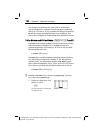
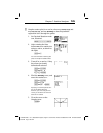
7. Move the cursor to the end
point of line.
"!$# (as
necessary)
8. Draw the line.
b
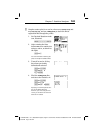
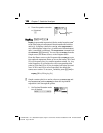
9. Adjust line with cursor
keys, if necessary.
"!$#
b(when finished)
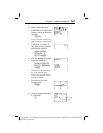
10. View the equation in the
Y= editor, if desired.
&
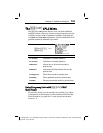
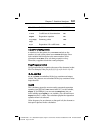
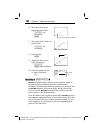
Med-Med Med-Med
-
v
!
4 4
Med-Med
(Median-Median) fits the model equation,
y=ax+b
, to
the data using the median-median line (resistant line)
technique, calculating the summary points
x1
,
y1
,
x2
,
y2
,
x3
, and
y3
.
Med-Med
displays values for
a
(slope) and
b
(y-intercept).
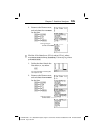
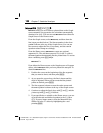
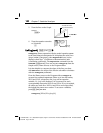
You can execute
Med-Med
from either the Graph screen, the
Home screen, or the Program editor.
From the Home screen or the Program editor,
Med-Med
accepts
four optional arguments. Enter up to two list names, XList and
YList; a frequency list, freq; and an equation variable, Yn. freq
is the frequency of occurrence for each corresponding data
point in XList and YList.
Cursor changes to a small box.
ax+b
Y
2
,
Y
3
, and
Y
4
may vary.