


116
Chapter 6: Statistical Plots
7306ENG.DOC Statistical Plots and Analyses Julie Hewlett Revised: 05/29/98 3:52 PM Printed: 05/19/99 9:00 AM
Page 116 of 20
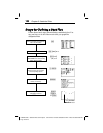
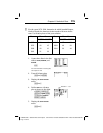
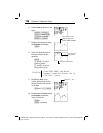
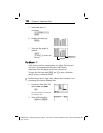
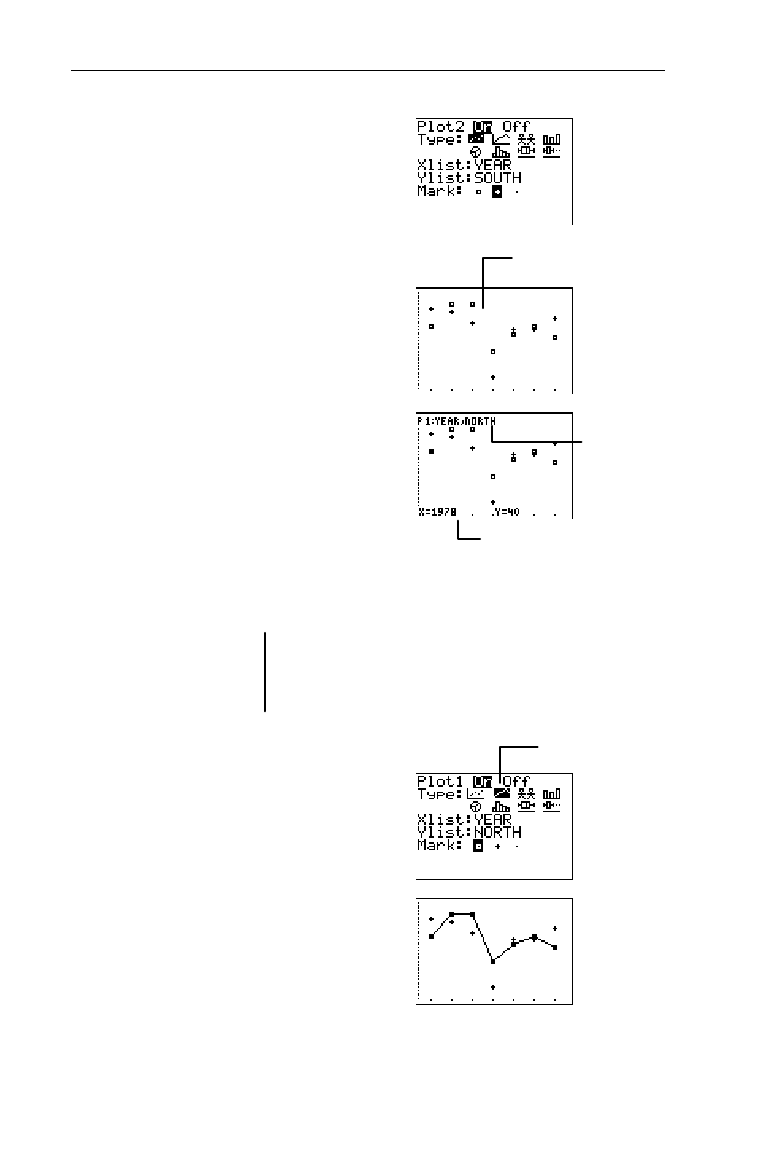
6. Define
Plot2
as shown to the
right.
2
b#b#
-v
YEAR
b
#-v
SOUTH
b#"b
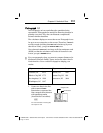
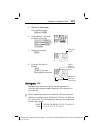
7. Display the stat plots using
the
ZoomStat
command.
(
7
8. Trace the Scatter plots to
find the solution to the
question.
)
! and " (to trace
point to point)
$ and # (to move
from plot to plot)
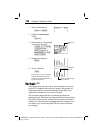
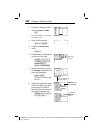
9. Redefining
Plot1
as an
xyLine plot makes it even
easier to follow the trends
of its data.
-e
1
#"b
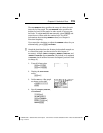
10. Display
Plot1
and
Plot2
using
the
ZoomStat
command.
Trace, if desired.
(
7
) (optional)
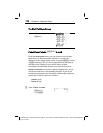
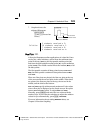
Solution
From 1978-1984, the North
League's home run hitter led in
4 of the 7 years.
Using different marks
helps you distinguish
between
Plot1
and
Plot2
.
The X and Y coordinates
The plot that is
being traced
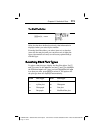
Select the
Ó
icon.