


176
Chapter 9: Function Graphing
7309ENG.DOC CH 9 Function Graphing, English Julie Hewlett Revised: 07/29/98 12:14 PM Printed: 05/19/99
9:01 AM Page 176 of 24
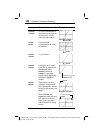
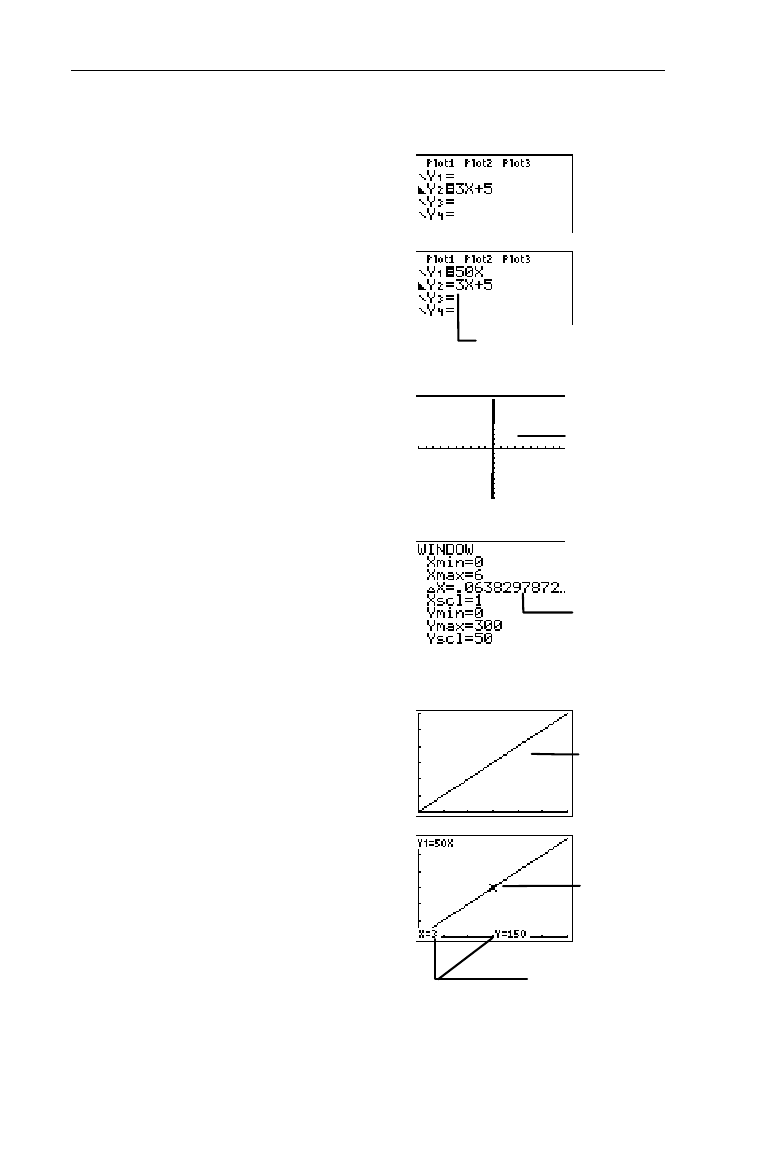
Graph the function, Y
1
=50X, on your calculator.
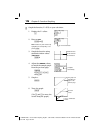
1. Display the Y= editor.
&
2. Enter
Y
1
=50X.
:
50
I
Note:
Deselect any other functions by
highlighting the corresponding = and
pressing
b
.
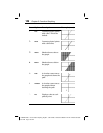
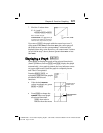
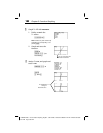
3. Graph the function using
standard window values
(
ZStandard
).
(
6
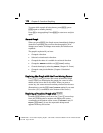
4. Adjust the
WINDOW
values
to match the sample graph
from the previous page.
'
0
#
6
##
1
#
0
#
300
#
50
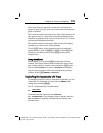
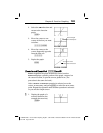
5. Graph
Y
1
.
*
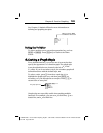
6. Trace the graph.
)
(Use ! and " to move the
cursor along the graph.)
³
Y
2
is now deselected.
Standard values
do not work well
for all functions.
@
x adjusts
automatically.
The graph now
resembles the
graph on the
previous page.
The trace
cursor.
X
- and
Y
- coordinates
of cursor.