


Chapter 7: Statistical Analyses
145
7307ENG.DOC CH 7, Statistical Analyses, English Julie Hewlett Revised: 07/29/98 12:07 PM Printed: 05/19/99
9:00 AM Page 145 of 22
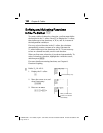
Graph a scatter plot for
L
1
and
L
2
, where
L
1
={1,3,4,5,5,7,8,9}
and
L
2
={1,4,2,3,4,6,7,9}
, and use
QuadReg
to draw the quadratic
regression curve through the points.
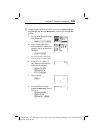
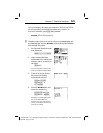
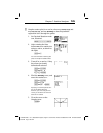
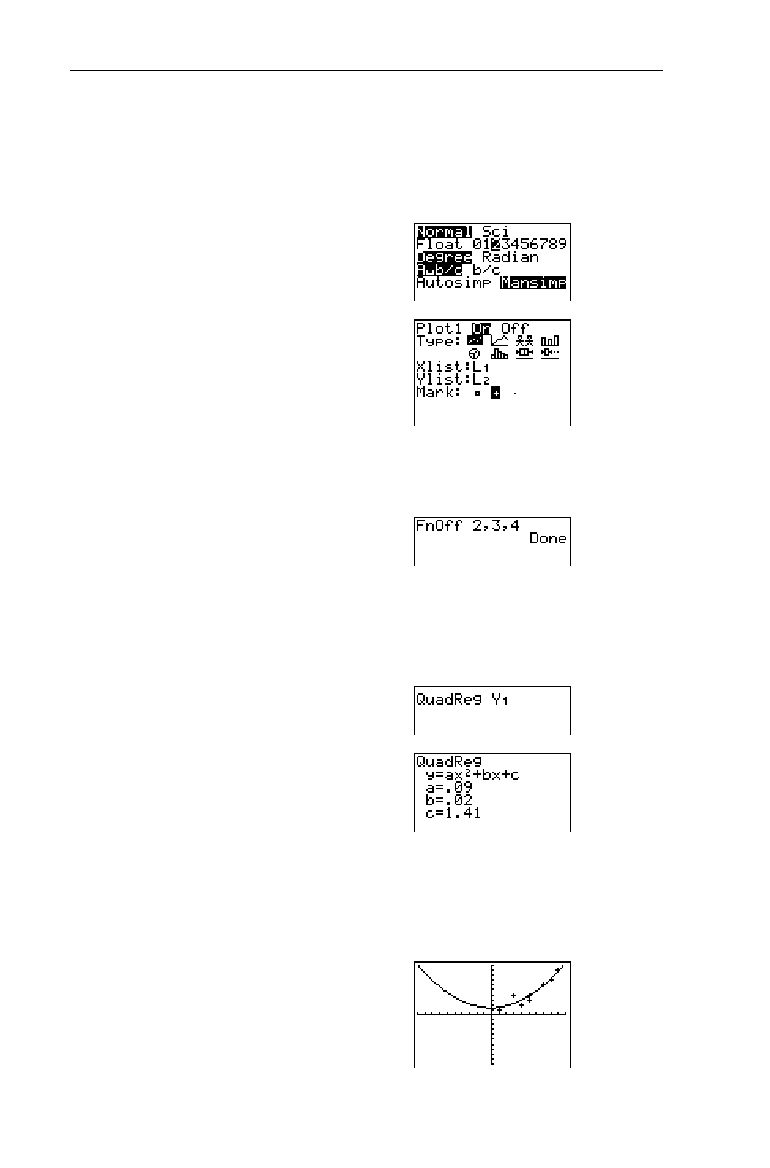
1. Set Decimal Notation mode
to
2
, if desired.
.#"""b
2. After entering the lists,
define
Plot1
as a scatter plot
using
L
1
and
L
2
, as shown to
the right.
-e
For more information on defining Stat
plots, see Chapter 6: Statistical Plots.
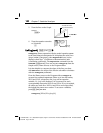
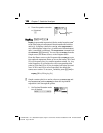
3. Turn off
Y
2
,
Y
3
and
Y
4
, if they
have been previously
defined and selected.
-l:
-}
2
6
2
¡
3
¡
4
b
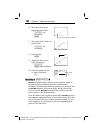
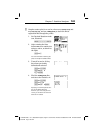
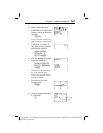
4. Find the
QuadReg
curve, and
store the results to
Y
1
.
-l:
-v!
6
-}
2
1
b
Specifying
¨
1
and
¨
2
is optional since
they are the default
listnames
.
However, if you were using other list
names, you would have to enter them
before the
Yn
variable.
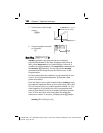
5. View the curve on the
Graph screen.
(
6
³