


184
Chapter 9: Function Graphing
7309ENG.DOC CH 9 Function Graphing, English Julie Hewlett Revised: 07/29/98 12:14 PM Printed: 05/19/99
9:01 AM Page 184 of 24
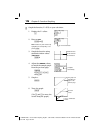
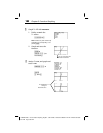
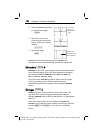
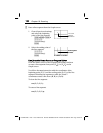
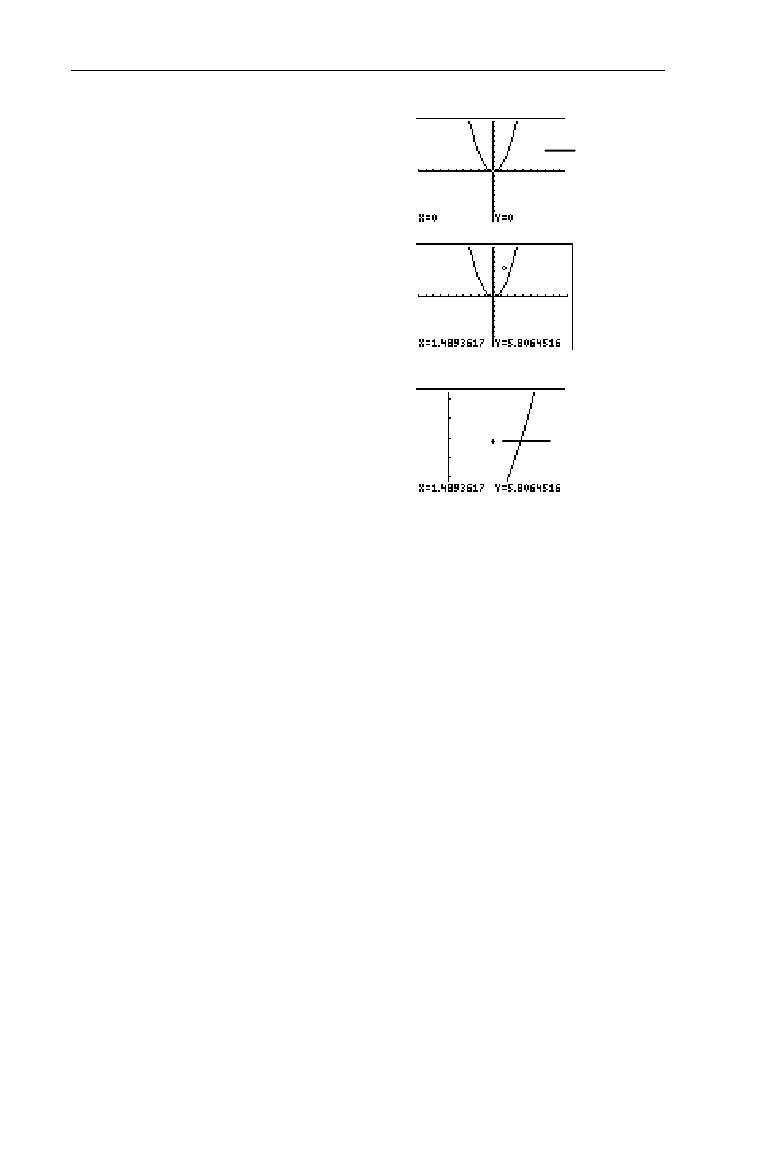
2. Select the
Zoom In
operation
for the function graph.
(
2
3. Move the cursor to the
point that you want as the
center of the new viewing
window.
"!$#
4. Replot the graph.
b
Zoom Out
works exactly the same way as
Zoom In
. The
calculator zooms out automatically around the center point.
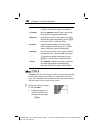
ZStandard ZStandard
(
6 6
ZStandard
is one of the more popular zoom commands because
many function graphs look good when graphed according to
the standard (default)
WINDOW
values:
Xmin=M10
,
Xmax=10
,
Xscl=1
,
Ymin=-M10
,
Ymax=10
,
Yscl=1
.
If you select the
ZStandard
operation, either from the Graph
screen or another screen, all selected functions are
immediately replotted according to these standard
WINDOW
values.
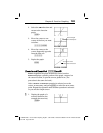
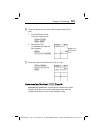
ZInteger ZInteger
(
0 0
ZInteger
requires you first to select a new center point. The
calculator then replots the graph immediately using the
adjusted
WINDOW
values which set
@X
and
@Y
to 1, and
Xscl
and
Yscl
to 10.
Select the center point (as you would do for
ZoomIn
and
ZoomOut
) by moving the cursor with the cursor keys, and then
pressing b. Press ) to view the new coordinate
values.
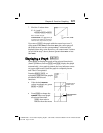
You want to
zoom in on
this side of the
graph.
The cursor point
becomes the center
of the new window.