


174
Chapter 9: Function Graphing
7309ENG.DOC CH 9 Function Graphing, English Julie Hewlett Revised: 07/29/98 12:14 PM Printed: 05/19/99
9:01 AM Page 174 of 24
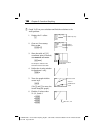
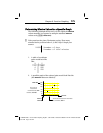
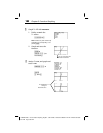
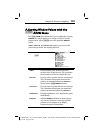
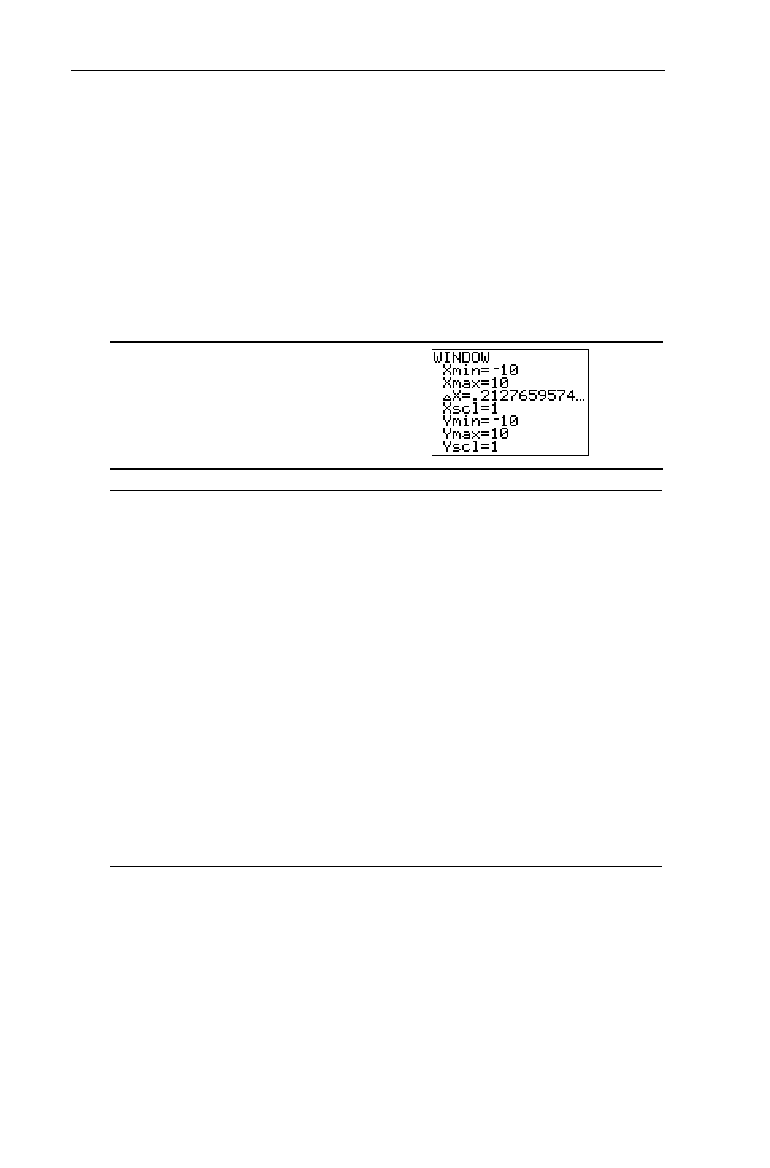
The Window Values Screen The Window Values Screen '
WINDOW
values put specific boundaries on the display. For an
explanation of
@X
,
see the section in this chapter entitled
Controlling the Increments of a Trace.
To exit the
WINDOW
menu, select another screen by pressing
the appropriate key, or press
-
l
to return to the Home
screen.
'
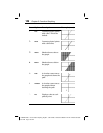
Xmin
The minimum value on the X-axis; must be less
than
Xmax
.
Xmax
The maximum value on the X-axis.
@x
When tracing the graph with
)
, this
determines the increments between X values.
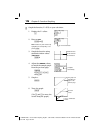
Xscl
The distance between tick marks on the X-axis.
To turn off the tick marks, set
Xscl=0
.
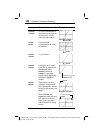
Ymin
The minimum value on the Y-axis; must be less
than
Ymax
.
Ymax
The maximum value on the Y-axis.
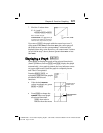
Yscl
The distance between tick marks on the Y-axis.
To turn off the tick marks, set
Yscl=0
.