


122
Chapter 6: Statistical Plots
7306ENG.DOC Statistical Plots and Analyses Julie Hewlett Revised: 05/29/98 3:52 PM Printed: 05/19/99 9:00 AM
Page 122 of 20
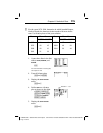
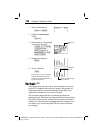
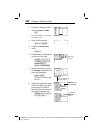
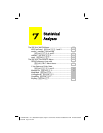
1. Create two lists in the List
editor,
SCORE
and
FREQ
.
3
For more information on entering lists,
see Chapter 5: Lists.
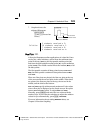
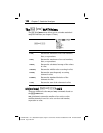
2. Turn off all stat plots.
-e
4
b
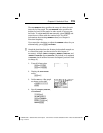
3. Display the
STAT PLOTS
menu.
-e
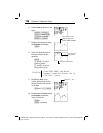
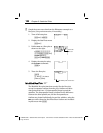
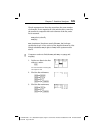
4. Define
Plot1
as a Histogram
as shown to the right.
1
b#""""
"b#-v
SCORE
b#
-v
FREQ
b
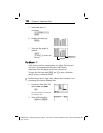
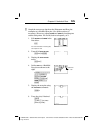
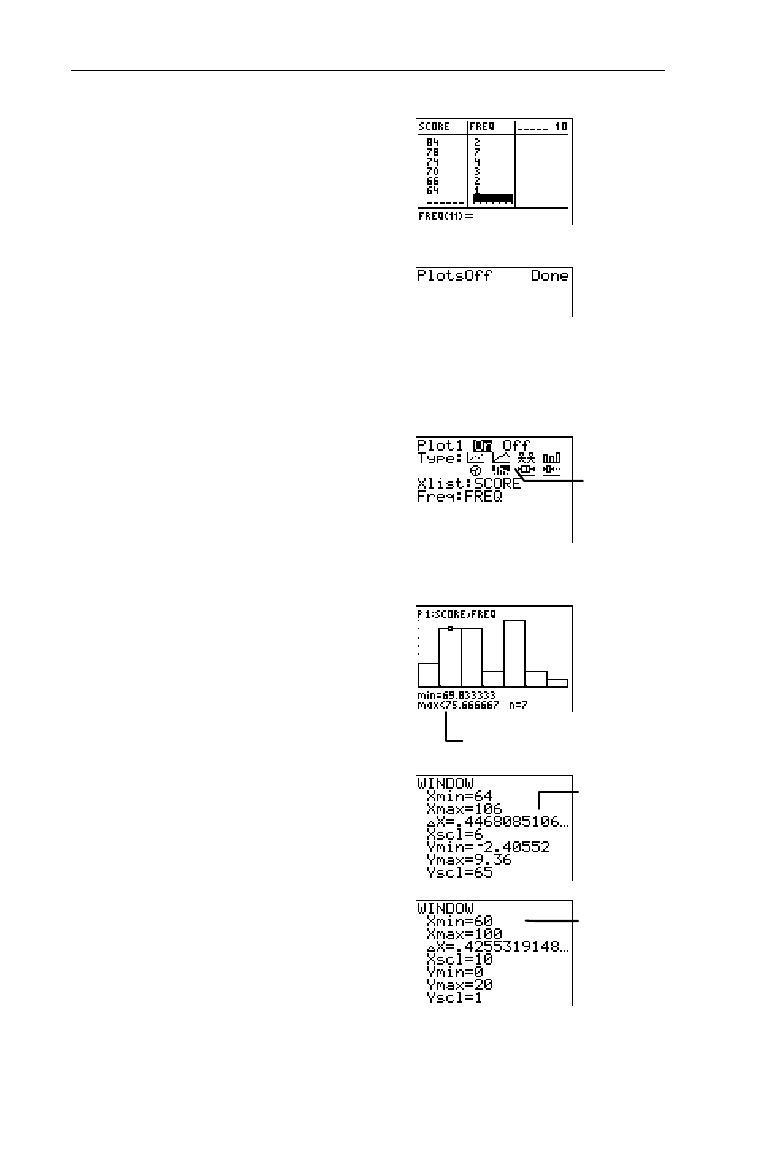
5. Display the stat plot using
the
ZoomStat
command and
trace the Histogram.
(
7
)
! and " (to trace bar
to bar)
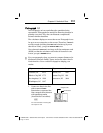
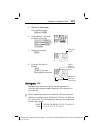
6. Adjust the graphing window
so that the data is grouped
in intervals of 10 and so
that the lowest test score is
60 and the highest is 100.
'
60
#
100
##
10
#
0
#
20
#
1
WINDOW
values
from
ZoomStat
The adjusted
WINDOW
values
Select the
Ò
icon.
7 scores fall between
the min and max.