


Chapter 7: Statistical Analyses
137
7307ENG.DOC CH 7, Statistical Analyses, English Julie Hewlett Revised: 07/29/98 12:07 PM Printed: 05/19/99
9:00 AM Page 137 of 22
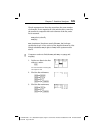
Variables Definition VARS Menu
r
Correlation coefficient
EQ
r
2
or R
2
Coefficient of determination
EQ
RegEQ
Regression equation
EQ
x1,y1,x2,y2,
x3,y3
Summary points
PTS
a, b, c
Regressionà fit coefficients
EQ
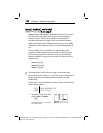
n (number of data points)
n
=number of
x
data points in a
1-Var Stats
analysis or the
number of
x
and
y
data points in a
2-Var Stats
analysis. Since
both variable lists always have the same number of list
elements in
2-Var Stats
,
n
for
x
is always equal to
n
for
y
.
Therefore,
n
applies to both the
x
and
y
analyses.
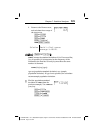
freq (Frequency Lists)
If freq is specified,
n
is equal to the sum of the elements in that
list. For example, if the freq is {2,2,3,1,2},
n
={2+2+3+1+2}=10.
Q
1
, Q
3
, and Med
Q
1
,
Q
3
, and
Med
are undefined if the freq contains non-integer
values. They also are not calculated if the freq contains a value
larger than 99.
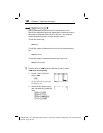
RegEQ
The calculator stores the most recently generated regression
equation (see - v
CALC
menu items 37) to the variable,
RegEQ
. If, for example, you execute
5: LinReg(ax+b)
, but you
dont initially store
RegEQ
to a
Y
n
variable, you can later insert
RegEQ
into the Y= editor. The calculator graphs the regression
equation when it is selected.
If the frequency for an element or data pair is 0, the element or
data pair is ignored in the calculation.