


108
Chapter 6: Statistical Plots
7306ENG.DOC Statistical Plots and Analyses Julie Hewlett Revised: 05/29/98 3:52 PM Printed: 05/19/99 9:00 AM
Page 108 of 20
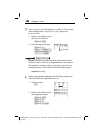
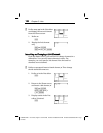
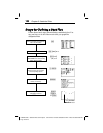
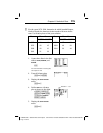
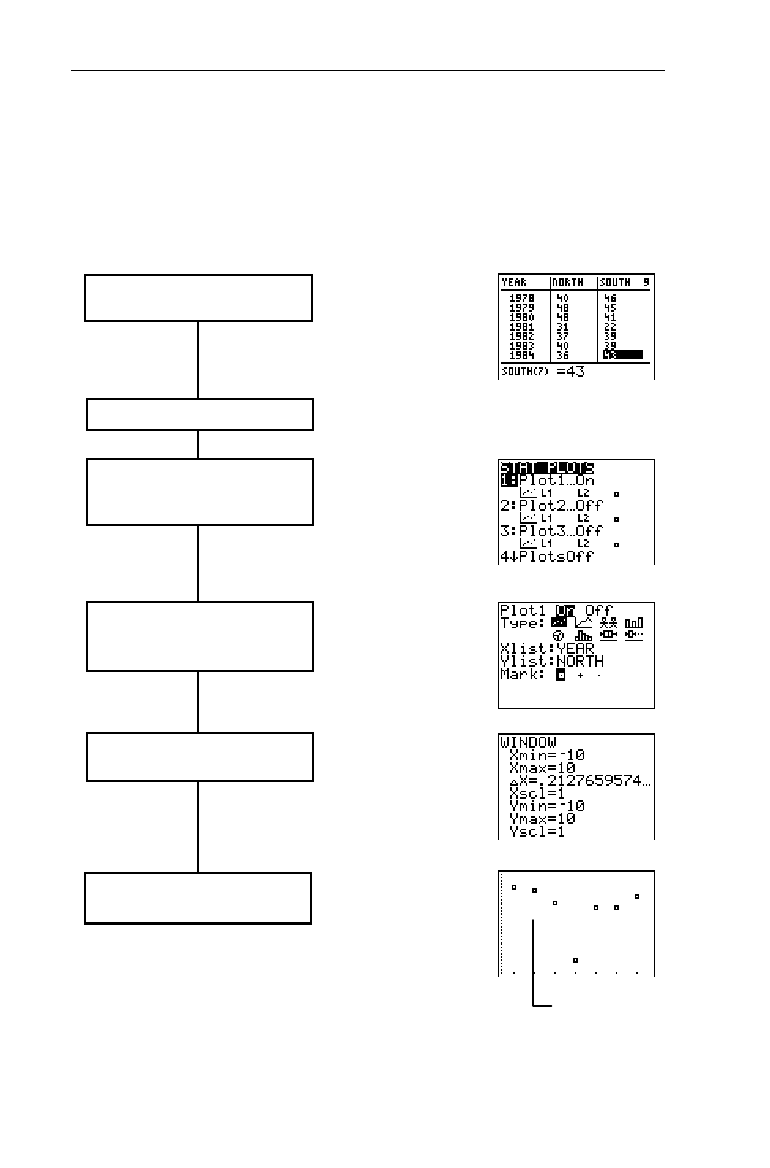
Steps for Defining a Stat Plot
Follow these basic steps when defining a statistical plot. You
may not have to do all of them each time you graph the
designated lists.
Define numerical and categorical
lists in the List editor.
Define the stat plot by entering the
STAT PLOTS menu and selecting
Plot1, Plot2, or Plot3.
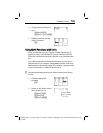
Using ZoomStat
WINDOW values.
Graph the stat plot. Trace the plot
with ), if desired.
Turn on the stat plot,
select the Plot Type and define
all corresponding options.
3
-
e
1
,
2
,
or
3
*
(
7
or
)
Deselect Y
n
functions, if desired.
-
}
2
6
Adjust the WINDOW values and
format, if necessary.
'
"
b