


Chapter 9: Function Graphing
165
7309ENG.DOC CH 9 Function Graphing, English Julie Hewlett Revised: 07/29/98 12:14 PM Printed: 05/19/99
9:01 AM Page 165 of 24
Example of Function Graphing
For every cookie Tham eats, Antonio eats two. How many
cookies does Antonio eat if Tham eats 1 cookie, 2 cookies, 3
cookies, and 4 cookies?
Find the equation that represents the relationship between
how many cookies Tham eats and how many Antonio eats,
and represent your answers in the form of a function graph.
These steps explain what the calculator does internally when
you define a function graph. The next page shows how to use
the TIN73 to find the answers to this example.
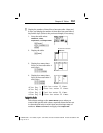
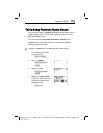
1. This example uses these
X values:
X=1
X=2
X=3
X=4
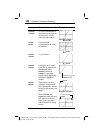
2. The TIN73 solves for Y
using specific X values.
Y = 2¦
X
Y = 2¦1 = 2
Y = 2¦2 = 4
Y = 2¦3 = 6
Y = 2¦4 = 8
3. It generates a table of
(X, Y) coordinate pairs
for you to look at.
XY
12
24
36
48
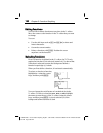
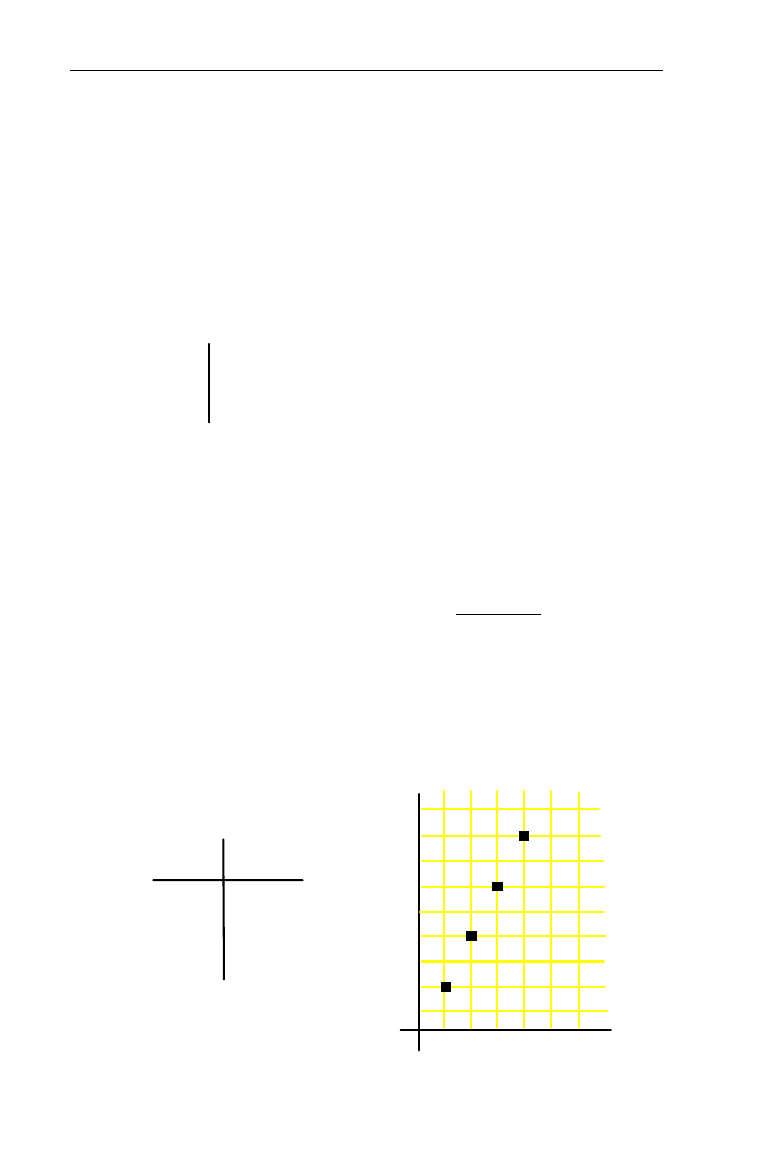
4. It graphs the (X,Y) pairs.
³
Y=2X
X=number of cookies Tham eats
Y=number of cookies Antonio eats
2
2
3
4
5
1
0
4
6
6
8