


Chapter 6: Statistical Plots
125
7306ENG.DOC Statistical Plots and Analyses Julie Hewlett Revised: 05/29/98 3:52 PM Printed: 05/19/99 9:00 AM
Page 125 of 20
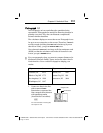
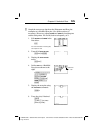
Graph the test scores data from the Histogram and Box plot
examples as a Modified Box plot. (See those sections, if
necessary.) However, adjust
SCORE
and
FREQ
by inserting two
outlier data points: 112 and 40, both at a frequency of 1.
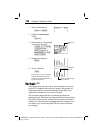
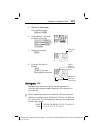
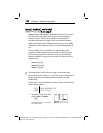
1. Edit
SCORE
and
FREQ
in the
List editor.
3
For more information on entering lists,
see Chapter 5: Lists.
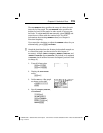
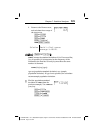
2. Turn off all
STAT PLOTS
.
-e
4
b
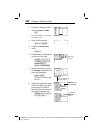
3. Display the
STAT PLOTS
menu.
-e
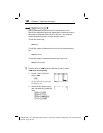
4. Define
Plot1
as a Modified
Box plot as shown to the
right.
1
b#""""
"""b#
-v
SCORE
b#-v
FREQ
b#"
b
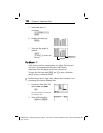
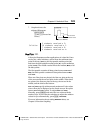
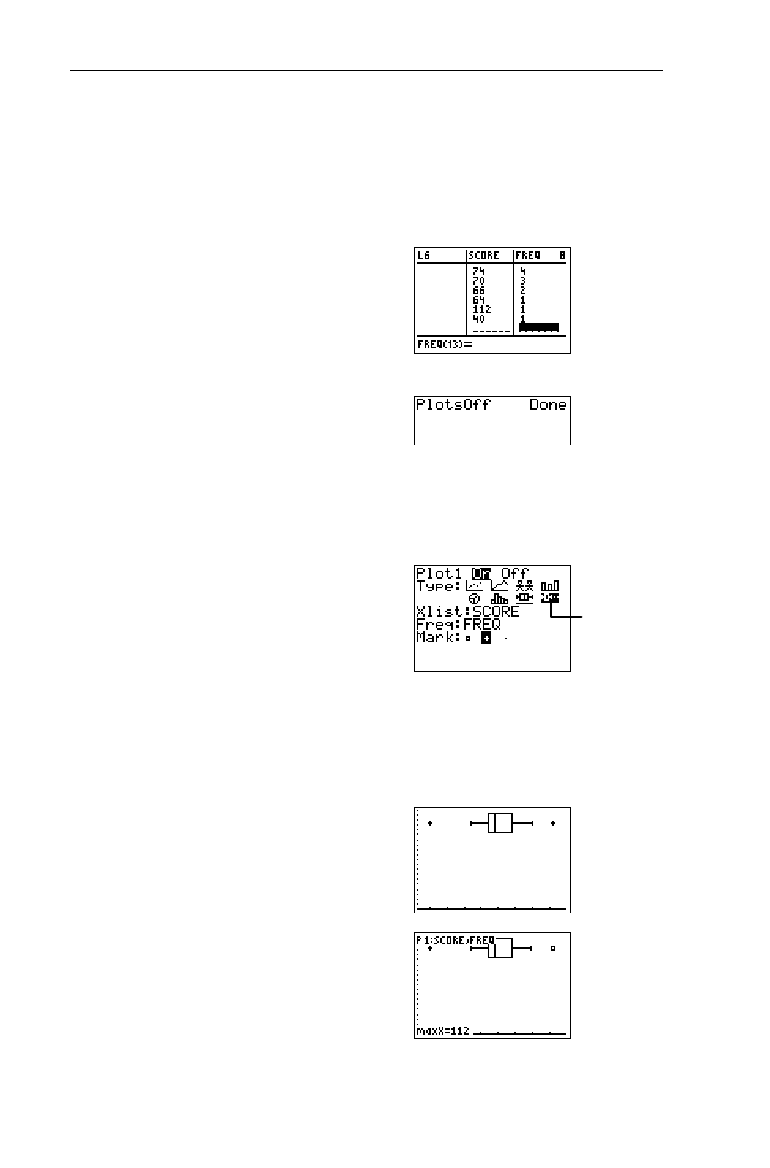
5. Display the stat plot using
the
ZoomStat
command.
(
7
6. Trace the plot, if desired.
)
! and " (to trace
point to point)
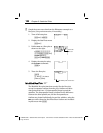
³
Select the
Õ
icon.