


Chapter 9: Function Graphing
169
7309ENG.DOC CH 9 Function Graphing, English Julie Hewlett Revised: 07/29/98 12:14 PM Printed: 05/19/99
9:01 AM Page 169 of 24
See Chapter 6: Statistical Plots for more information on
defining and graphing stat plots.
Exiting the Y= EditorExiting the Y= Editor
To select another screen, press the appropriate key, such as
* or '. Press - l to return to the Home
screen.
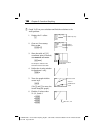
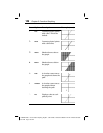
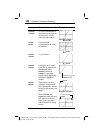
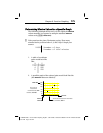
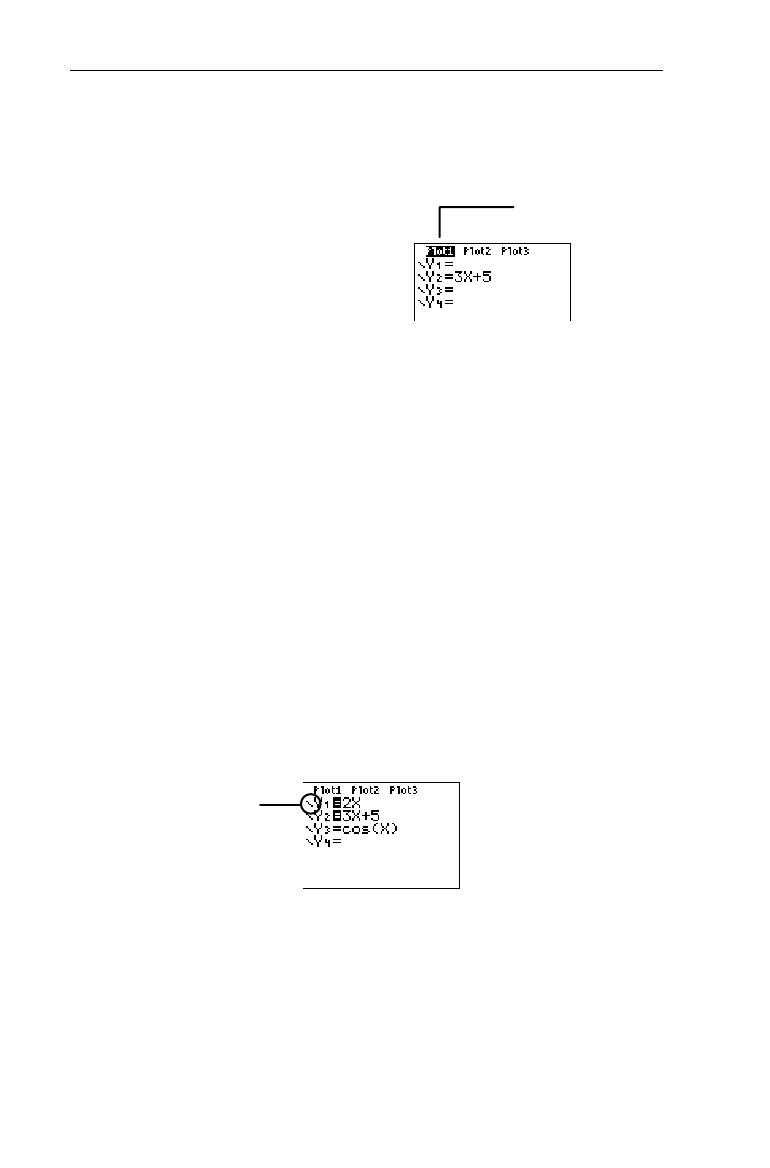
Selecting a Graph Style
For a defined function, you can set one of seven styles that
specify the appearance of a function graph. The graph style
icons described below are located to the left of
Y
n
in the
Y= editor. If you do not select a style, the calculator graphs all
defined functions with the default style,
Line
.
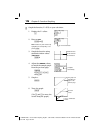
To select a style, press ! from the
Y
n
equal sign (
=
) to
highlight the graph style icon, and then press b, as
necessary, to cycle through the seven styles. Press " " to
return to the
Y
n
entry line.
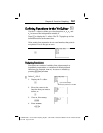
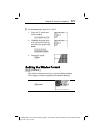
Graph styles are especially useful when graphing multiple
functions. For example, you can set
Y
1
as a solid line,
Y
2
as a
dotted line, and
Y
3
as a thick line.
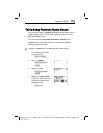
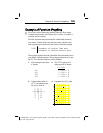
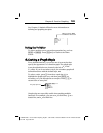
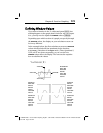
The graph style icon.
Plot1
is selected.
Plot2
and
Plot3
are deselected.