


Appendix A: Function and Instruction Reference
313
73A-ENG.DOC AppxA: Function/Instruction Reference, English Julie Hewlett Revised: 07/29/98 1:10 PM Printed:
05/19/99 9:03 AM Page 313 of 36
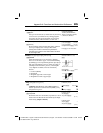
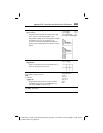
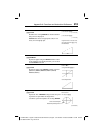
ZoomStat
(
ZOOM
Redefines the viewing
WINDOW
so that all statistical
data points are displayed.
ZoomStat
also selects an appropriate scale, if one
exists, for a Pictograph plot.
{1,2,3,4,5,6}
Ü
L
1
b
{1 2 3 4 5 6}
{1,2,3,4,5,6}
Ü
L
2
b
{1 2 3 4 5 6}
Graph and trace a Scatter stat
plot using L
1
and L
2
(
-
e
)
and ZoomStat.
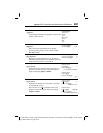
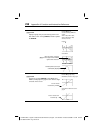
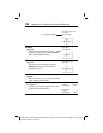
ZPrevious
(
MEMORY
Replots the graph using the
WINDOW
variable values
of the graph that was displayed before you executed
the last
ZOOM
instruction.
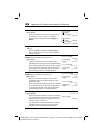
ZQuadrant1
(
ZOOM
Replots the graph using
WINDOW
variable values for
Quadrant I (
Xmin=0
,
Xmax=9.4
,
Xscl=1, Ymin=0
,
Ymax=9.4
,
Yscl=1
).
Define Y=X
using ZStandard (
(
6).
Select ZQuadrant1.
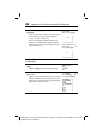
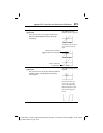
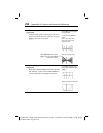
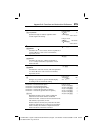
ZSquare
(
ZOOM
Adjusts the
X
or
Y
WINDOW
settings so that each pixel
represents an equal width and height in the
coordinate system and updates the viewing
WINDOW
.
Select ZStandard. Return to th
e
Home screen.
Circle(0,0,7)
b
(
Continued
)
Circle is oval shaped
instead of perfectly round.