


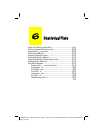

Chapter 6: Statistical Plots
109
7306ENG.DOC Statistical Plots and Analyses Julie Hewlett Revised: 05/29/98 3:52 PM Printed: 05/19/99 9:00 AM
Page 109 of 20
Defining Statistical Data in Lists
Statistical plots (stat plots) are graphical representations of
data that has been stored in lists. Therefore, since you need to
create your lists before you can define stat plots, review
Chapter 5: Lists for information on naming and creating both
numerical and categorical lists.
Note: All examples in this chapter assume that you know how
to enter lists in the List editor.
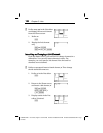
Deselecting
Y
n
Functions
When you press * or a ( command, the calculator
graphs all selected
Y
n
functions (defined in the Y= editor) and
graphs all stat plots that are defined and turned on. If you have
defined and selected functions in the Y= editor and you dont
want them displayed with your stat plots, deselect all defined
functions with - }
2:Y-Vars
6:FnOff
.
For more information on defining and selecting functions in
the Y= editor, see Chapter 9: Function Graphing.
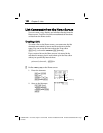
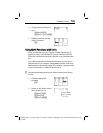
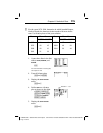
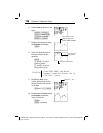
Defining a Stat Plot
Once you have data lists stored in the calculator, you need to
define the stat plot. This requires two steps:
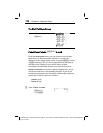
1. Press - e to display the
STAT PLOTS
menu screen.
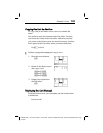
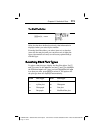
2. Select
1
,
2
, or
3
to enter the Stat Plot editor for
Plot1
,
Plot2
,
or
Plot3
. Selecting
4
or
5
turns all stat plots off or on when
you graph.