


144
Chapter 7: Statistical Analyses
7307ENG.DOC CH 7, Statistical Analyses, English Julie Hewlett Revised: 07/29/98 12:07 PM Printed: 05/19/99
9:00 AM Page 144 of 22
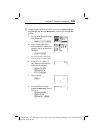
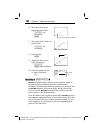
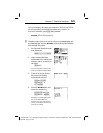
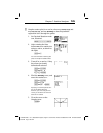
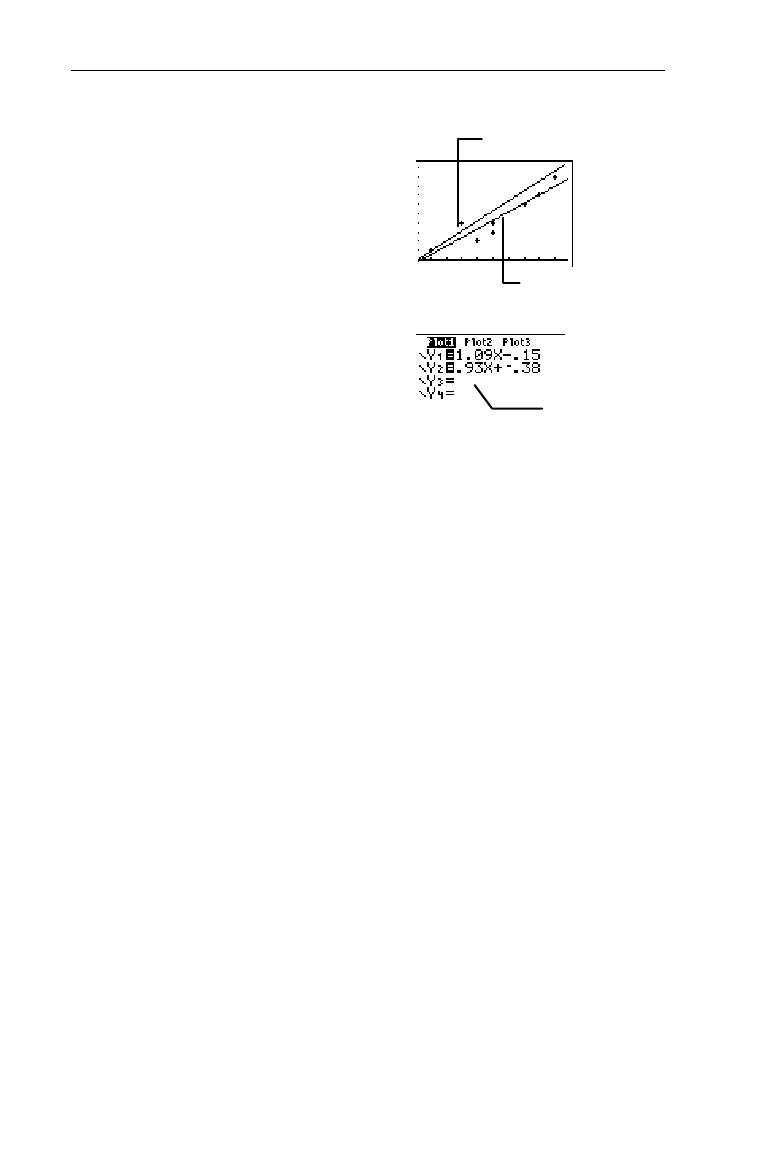
5. View the line on the Graph
screen.
(
7
6. View the equation stored to
Y
2
, if desired.
&
QuadReg QuadReg
-
v
!
6 6
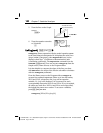
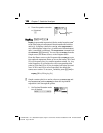
QuadReg
(quadratic regression) fits the second-degree
polynomial
y=ax
2
+bx+c
to the data. It displays values for
a
,
b
,
and
c
; when
DiagnosticOn
is set, it also displays a value for
r
2
(coefficient of determination). The
DiagnosticOn
command is in
the
CATALOG
(- |). You can execute the
QuadReg
command from the Graph screen, the Home screen, or the
Program editor.
For three data points, the equation is a polynomial fit; for four
or more, it is a polynomial regression. At least three data
points are required.
From the Home screen or the Program editor,
QuadReg
accepts
four optional arguments. Enter up to two list names, XList and
YList; a frequency list, freq; and an equation variable, Yn. freq
is the frequency of occurrence for each corresponding data
point in XList and YList. If freq is omitted, all values are used
once. If XList and YList are not specified, the default list
names are
L
1
and
L
2
. To access
Y
n
variables, press - }
2
.
QuadReg
[XList,YList,freq,Yn]
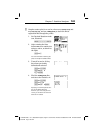
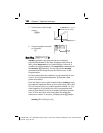
The
LinReg(ax+b)
line
The
Manual-Fit
line,
Y
1
(see
example from that section)
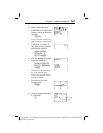
Y
3
and
Y
4
may vary.