


214
Chapter 11: Trigonometry
7311ENG.DOC CH 11 Trigonometry, English Julie Hewlett Revised: 05/26/98 11:12 AM Printed: 05/19/99 9:02
AM Page 214 of 12
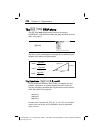
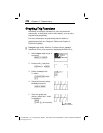
Graphing Trig Functions
In addition to using the calculator to solve trig functions
numerically, as described so far in this chapter, you can solve
trig functions graphically.
For more information on generating function tables or
graphing functions, see Chapter 8: Tables and Chapter 9:
Function Graphing.
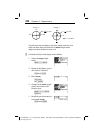
In
Degree
Angle mode, find four Y values where
Y
1
=tan(X)
is
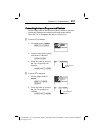
undefined. Check your answer by displaying the table for
Y
1
.
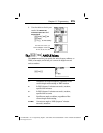
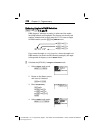
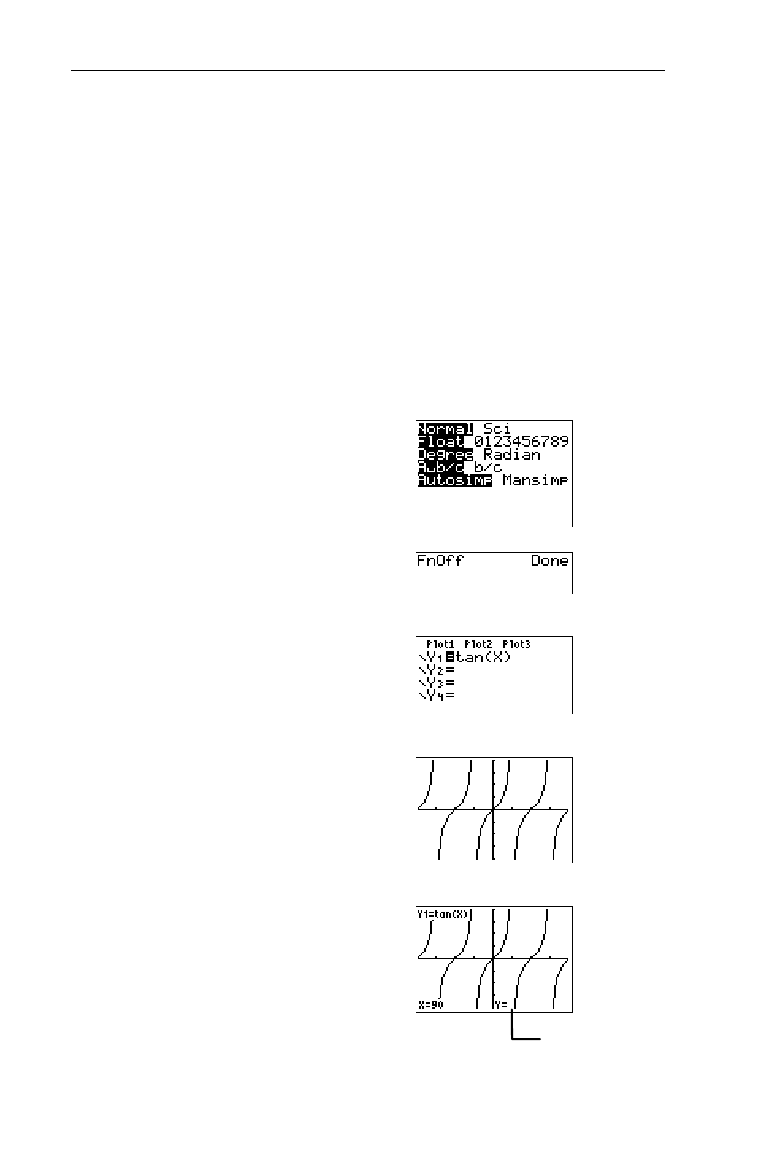
1. Select
Degree
Angle mode, if
necessary.
.##b
2. Deselect all
Y
n
functions.
-}
2
6
b
3. Define
Y
1
=tan(X)
in the
Y= editor.
&:-u
5
IE
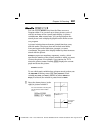
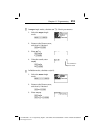
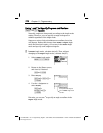
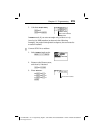
4. Graph the function using
the
ZTrig
command.
($b
5. Trace the graph and
observe where the Y value
is undefined.
)
" and ! , as necessary
³
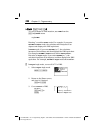
When
X=90
,
Y
is undefined.