


Chapter 9: Function Graphing
181
7309ENG.DOC CH 9 Function Graphing, English Julie Hewlett Revised: 07/29/98 12:14 PM Printed: 05/19/99
9:01 AM Page 181 of 24
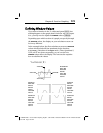
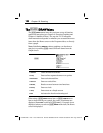
Adjusting Window Values with the
(
ZOOM Menu
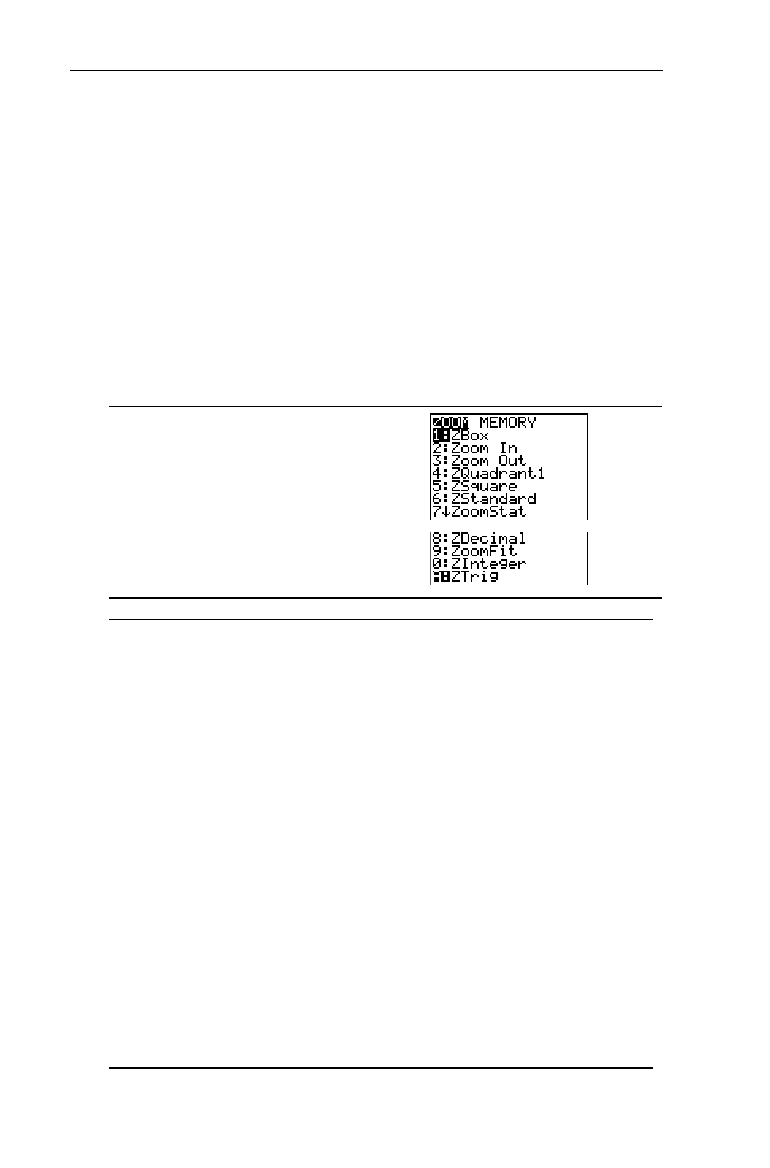
The (
ZOOM
menu items allow you to adjust the viewing
WINDOW
of a graph quickly in a variety of ways. From the
Graph screen, press ' to see the adjusted
WINDOW
values.
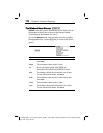
1:ZBox
,
2:Zoom In
, and
3:Zoom Out
, require you to move the
cursor first to define the viewing window.
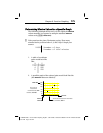
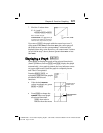
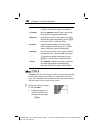
(
1:ZBox
Lets you draw a box around a specific
section of the Graph screen. The calculator
then zooms in on the area inside the box.
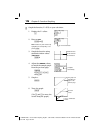
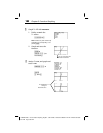
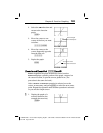
2:Zoom In
Lets you select a point with the cursor keys.
The calculator then zooms in around the
point by an amount defined by
SetFactors
(found on the (
MEMORY
menu).
3:Zoom Out
Lets you select a point with the cursor keys.
The calculator then zooms out around the
point by an amount defined by
SetFactors
.
4:ZQuadrant1
Displays Quadrant I only. Replots the graph
immediately.
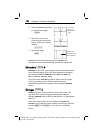
5:ZSquare
Adjusts
WINDOW
variables so that a square
or a circle is shown in correct proportion
(instead of a rectangle or an ellipse).
Replots the graph immediately.