


120
Chapter 6: Statistical Plots
7306ENG.DOC Statistical Plots and Analyses Julie Hewlett Revised: 05/29/98 3:52 PM Printed: 05/19/99 9:00 AM
Page 120 of 20
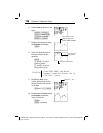
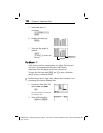
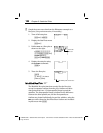
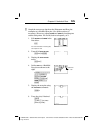
5. Select
Vert
and
2
, if
necessary.
##b"""
b
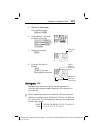
6. Display the stat plots.
*
7. Trace the Bar graph, if
desired.
)
! and " (to trace bar
to bar)
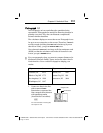
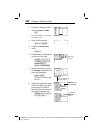
Pie Chart Pie Chart
Ï
A Pie chart is used to compare parts of a whole. The area of a
pie piece is proportional to the part of 100% that it
represents. You can display up to seven pie pieces.
To trace the Pie chart with ), use " to trace clockwise
and ! to trace counterclockwise.
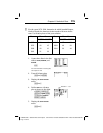
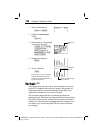
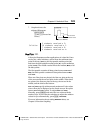
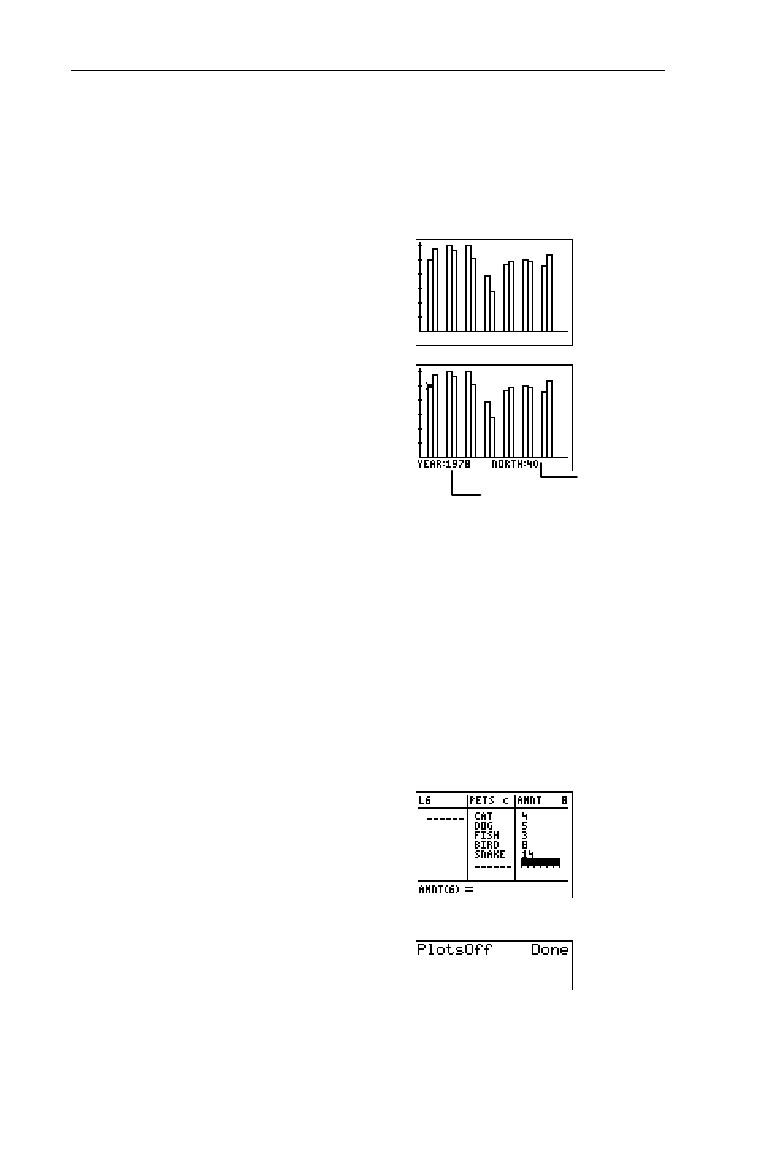
Keisha owns 4 cats, 5 dogs, 3 fish, 8 birds, and 14 snakes. Use a
percentage Pie chart to illustrate this.
1. Create two lists in the List
editor,
PETS
and
AMNT
.
3
For more information on entering lists,
see Chapter 5: Lists.
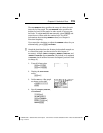
2. Turn off all stat plots.
-e
4
b
³
CategList
DataList
Name
and bar value