


Chapter 6: Statistical Plots
117
7306ENG.DOC Statistical Plots and Analyses Julie Hewlett Revised: 05/29/98 3:52 PM Printed: 05/19/99 9:00 AM
Page 117 of 20
Pictograph Pictograph Î
In a Pictograph, an icon symbolizes the quantities being
represented. Pictographs are useful for observing changes in
quantity over time. They also can illustrate comparisons
between similar situations.
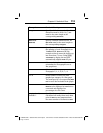
The calculator displays no more than seven Pictograph icons
for up to seven categories on the screen. Therefore, if
Scale
is
not big enough (meaning that
Data List
is broken up by more
than seven icons), you get an
INVALID
DIM
error.
If an element in
Data List
is too large to fit the maximum scale
(99999) so that the calculator cant make all icons fit in one
screen, you get a
DOMAIN
error.
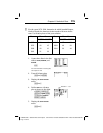
For your geography class, you want to compare distances (in
kilometers) between Dallas, Texas, and seven other cities in
North America. Use a vertical Pictograph to display your
results.
City km City km
Toronto, ON 2215 Denver, CO 1397
Mexico City, MX 1775 Kansas City, KS 836
Los Angeles, CA 2180 Vancouver, BC 3444
Washington, DC 1927
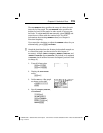
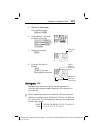
1. Create two lists in the List
editor,
CITY
and
DIST
.
Remember to surround the
first categorical list element
with quotation marks
(found in the Text editor).
3
For more information on entering lists,
see Chapter 5: Lists.
³
Categorical list
Numerical list