


Operating Instructions
1705A Spectrum Monitor
2-9
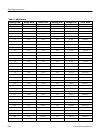
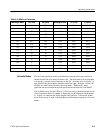
Table 2- 2: dBm to
v Conversion
Reading in dBm v(75Ω) v(50Ω) Reading in dBm v(75Ω) v(50Ω)
--- 3 0 8660 7071 --- 1 0 5 1.540 1.257
--- 3 5 4870 3976 --- 1 1 0 0.866 0.707
--- 4 0 2739 2236 --- 1 1 5 0.487 0.398
--- 4 5 1540 1257 --- 1 2 0 0.274 0.224
--- 5 0 866 707 --- 1 2 5 0.154 0.126
--- 5 5 487 398 --- 1 3 0 0.087 0.071
--- 6 0 274 224 --- 1 3 5 0.049 0.040
--- 6 5 154 126 --- 1 4 0 0.027 0.022
--- 7 0 87 71 --- 1 4 5 0.015 0.013
--- 7 5 49 40 --- 1 5 0 0.009 0.007
--- 8 0 27 22 --- 1 5 5 0.005 0.004
--- 8 5 15 13 --- 1 6 0 0.003 0.002
--- 9 0 9 7 --- 1 6 5 0.002 0.001
--- 9 5 5 4 --- 1 7 0 0.001 0.001
--- 1 0 0 3 2 --- 1 7 5 0.000 0.000
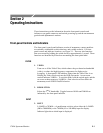
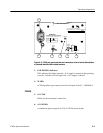
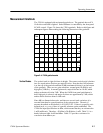
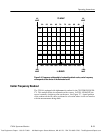
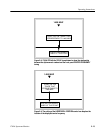
The horizontal graticule scales are divided into ten major divisions, which are
further divided into five minor divisions each. The horizontal scale corresponds
to frequency, with the lowest frequency to the left. Note the arrow in Figure 2-4
that signifies that the frequency ascends toward the right. Both the --60 and --80
dB lines are subdivided with minor division marks. Traditionally, many
spectrum analyzer measurements and specifications are between 6 and 60 dB.
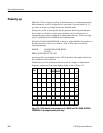
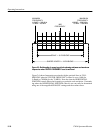
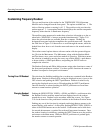
The available sweep for the 1705A is 12 divisions long, which means that not all
of the frequencies that it is capable of displaying can be displayed simultaneous-
ly. Figure 2-5 compares the sweep length to the graticule. It shows the usable
areas of the sweep, as well as the minimum and maximum frequencies of the two
bands.
Horizontal Scales