


Chapter 4—Metering Capabilities 63230-300-212
Min/Max Values for Real-time Readings April 2001
© 2001 Schneider Electric All Rights Reserved
54
instructions on working with logs using SMS, refer to the SMS online help file
included with the software.
All running min/max values, except for power factor, are arithmetic minimum
and maximum values. For example, the minimum phase A–Bvoltageisthe
lowest value in the range 0 to 1200 kV that has occurred since the
min/max values were last reset. In contrast, because the power factor’s
midpoint is unity (equal to one), the power factor min/max values are not true
arithmetic minimums and maximums. Instead, the minimum value represents
the measurement closest to –0 on a continuous scale for all real-time
readings –0 to 1.00 to +0. The maximum value is the measurement closest
to+0onthesamescale.
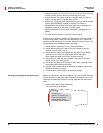
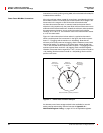
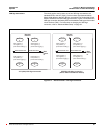
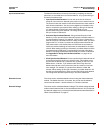
Figure 4–1 below shows the min/max values in a typical environment in
which a positive power flow is assumed. In the figure, the minimum power
factor is –.7 (lagging) and the maximum is .8 (leading). Note that the
minimum power factor need not be lagging, and the maximum power factor
need not be leading. For example, if the power factor values ranged from
–.75 to –.95, then the minimum power factor would be –.75 (lagging) and the
maximum power factor would be –.95 (lagging). Both would be negative.
Likewise, if the power factor ranged from +.9 to +.95, the minimum would be
+.95 (leading) and the maximum would be +.90 (leading). Both would be
positive in this case.
Figure 4–1: Power factor min/max example
An alternate power factor storage method is also available for use with
analog outputs and trending. See the footnotes in Appendix A—
Abbreviated Register Listing on page 127 for the applicable registers.
Power Factor Min/Max Conventions
Unity
1.00
Lag
(–)
Lead
(+)
–0
+0
.8
.6
.4
.2
.2
.4
.6
.8
Minimum
Power Factor
–.7 (lagging)
Maximum
Power Factor
.8 (leading)
Range of
Power Factor
Values
Note: Assumes a positive power flow