


Chapter 4—Metering Capabilities 63230-300-212
Demand Readings April 2001
© 2001 Schneider Electric All Rights Reserved
56
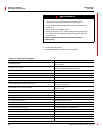
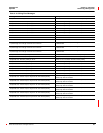
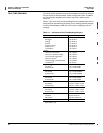
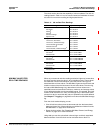
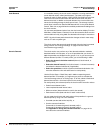
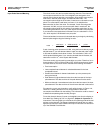
The circuit monitor provides a variety of demand readings, including
coincident readings and predicted demands. Table 4–3liststheavailable
demand readings and their reportable ranges.
Table 4–3: Demand Readings
Demand Readings Reportable Range
Demand Current, Per-Phase, 3Ø Average, Neutral
Last Complete Interval 0 to 32,767 A
Peak 0 to 32,767 A
Demand Voltage, L–N, L–L, Per-phase, Average, N-G
Last Complete Interval 0 to 1200 kV
Minimum 0 to 1200 kV
Peak
0to1200kV
Average Power Factor (True), 3Ø To t al
Last Complete Interval
–0.010 to 1.000 to +0.010
Coincident with kW Peak
–0.010 to 1.000 to +0.010
Coincident with kVAR Peak
–0.010 to 1.000 to +0.010
Coincident with kVA Peak
–0.010 to 1.000 to +0.010
Demand Real Power, 3Ø Tot al
Last Complete Interval
0 to ± 3276.70 MW
Predicted
0 to ± 3276.70 MW
Peak
0 to ± 3276.70 MW
Coincident kVA Demand
0 to ± 3276.70 MVA
Coincident kVAR Demand
0 to ± 3276.70 MVAR
Demand Reactive Power, 3Ø To ta l
Last Complete Interval
0 to ± 3276.70 MVAR
Predicted
0 to ± 3276.70 MVAR
Peak
0 to ± 3276.70 MVAR
Coincident kVA Demand
0 to ± 3276.70 MVA
Coincident kW Demand
0 to ± 3276.70 MW
Demand Apparent Power, 3Ø Total
Last Complete Interval
0 to ± 3276.70 MVA
Predicted
0 to ± 3276.70 MVA
Peak
0 to ± 3276.70 MVA
Coincident kW Demand
0 to ± 3276.70 MW
Coincident kVAR Demand
0 to ± 3276.70 MVAR
DEMAND READINGS