


Chapter 4—Metering Capabilities 63230-300-212
Demand Readings April 2001
© 2001 Schneider Electric All Rights Reserved
62
The circuit monitor has ten input pulse metering channels. The channels
count pulses received from one or more digital inputs assigned to that
channel. Each channel requires a consumption pulse weight, consumption
scale factor, demand pulse weight, and demand scale factor. The
consumption pulse weight is the number of watt-hours or kilowatt-hours per
pulse. The consumption scale factor is a factor of 10 multiplier that
determines the format of the value. For example, if each incoming pulse
represents 125 Wh, and you want consumption data in watt-hours, the
consumption pulse weight is 125 and the consumption scale factor is zero.
The resulting calculation is 125 x 10
0
, which equals 125 watt-hours per pulse.
If you want the consumption data in kilowatt-hours, the calculation is 125 x
10
-3
, which equals 0.125 kilowatt-hours per pulse.
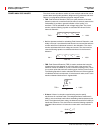
Time must be taken into account for demand data so you begin by calculating
demand pulse weight using the following formula:
If each incoming pulse represents 125 Wh, using the formula above you get
450,000 watts. If you want demand data in watts, the demand pulse weight
is 450 and the demand scale factor is three. The calculation is 450 x 10
3
,
which equals 450,000 watts. If you want the demand data in kilowatts, the
calculation is 450 x 10
0
, which equals 450 kilowatts.
The circuit monitor counts each input transition as a pulse. Therefore, for an
input transition of OFF-to-ON and ON-to-OFF will be counted as two pulses.
For each channel, the circuit monitor maintains the following information:
• Total consumption
• Last completed interval demand—calculated demand for the last
completed interval.
• Partial interval demand—demand calculation up to the present point
during the interval.
• Peak demand—highest demand value since the last reset of the input
pulse demand. The date and time of the peak demand is also saved.
• Minimum demand—lowest demand value since the last reset of the input
pulse demand. The date and time of the minimum demand is also saved.
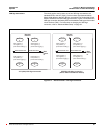
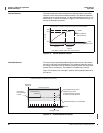
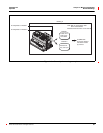
For example, you can use channels to verify utility charges. In Figure 4–6,
Channel 1 is adding demand from two utility feeders to track total
consumption and demand for the building. This information could be viewed
in
SMS and compared against the utility charges.
To use the channels feature, first set up the digital inputs from the display or
from
SMS.See“SettingUpI/Os” on page 23 in Chapter 3—Operation for
instructions. Then using
SMS, you must set the I/O operating mode to Normal
and set up the channels. The demand method and interval that you select
applies to all channels. See the
SMS online help for instructions on device set
up of the CM4000 Circuit Monitor.
Input Pulse Demand Metering
per pulse per hour per second
watt-hours x 3600 seconds x pulse
watts =